

Question: Using rough approximations of the data, re-create the line chart as a bar char. Which of these two formats does the better job of conveying
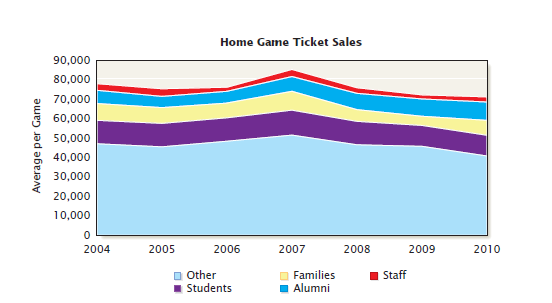
Using rough approximations of the data, re-create the line chart as a bar char. Which of these two formats does the better job of conveying the information?
Describe the most common options for presenting data in a visual format.
Average per Game 90,000 80,000 70,000 60,000 50,000 40,000 30,000 20,000 10,000 0 2004 2005 Home Game Ticket Sales 2006 Other Students 2007 Families Alumni 2008 2009 Staff 2010
Step by Step Solution
3.48 Rating (158 Votes )
There are 3 Steps involved in it
To recreate the line chart as a bar chart follow these steps Step 1 Understand the Data The area cha... View full answer

Get step-by-step solutions from verified subject matter experts