

Question: Using the McDonald's Financial Analysis and calculate the missing values McDonald's Financial Analysis (data in thousands [000s], excluding per share data and financial ratios) FY
Using the McDonald's Financial Analysis and calculate the missing values
![McDonald's Financial Analysis (data in thousands [000s], excluding per share data and](https://dsd5zvtm8ll6.cloudfront.net/si.experts.images/questions/2022/08/63077099c176a_96163077099b119f.jpg)
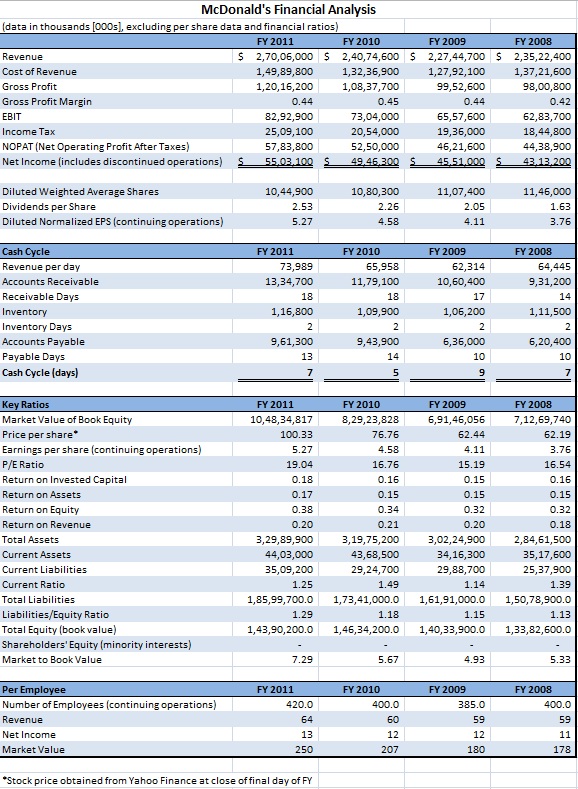
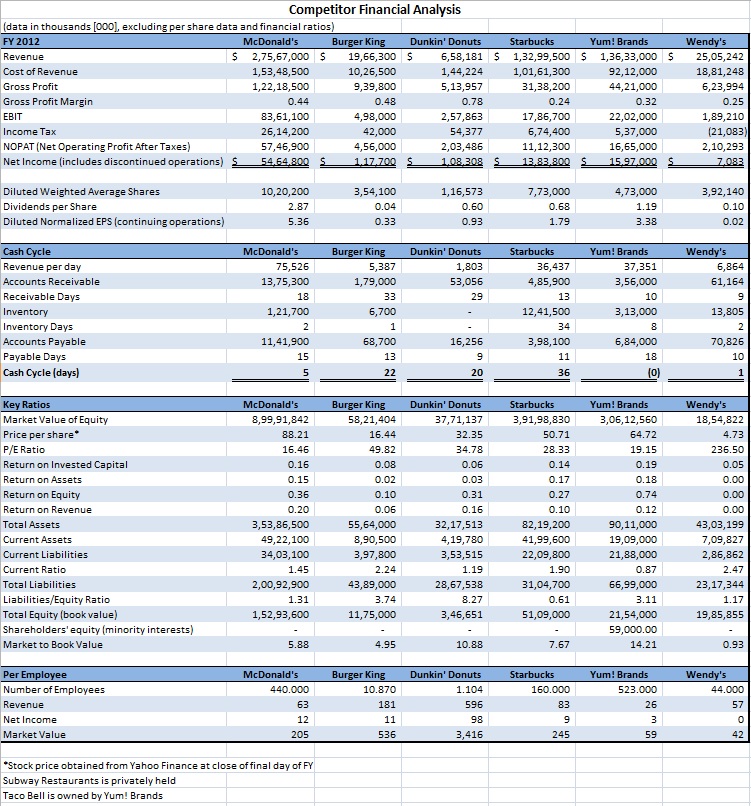
McDonald's Financial Analysis (data in thousands [000s], excluding per share data and financial ratios) FY 2012 Revenue $27,567,000 15,348,500 Cost of Revenue Gross Profit Gross Profit Margin EBIT Income Tax NOPAT (Net Operating Profit After Taxes) Net Income (includes discontinued operations) Diluted Weighted Average Shares Dividends per Share Diluted Normalized EPS (continuing operations) Cash Cycle Revenue per day Accounts Receivable 00 8,361,100 2,614,200 5,746,900 $ 5,464,800 1,020,200 5.36 FY 2012 1,375,300 (data in thousands [000s], excluding per share data and financial ratios) FY 2011 $ Revenue Cost of Revenue Gross Profit Gross Profit Margin EBIT Income Tax NOPAT (Net Operating Profit After Taxes) Net Income (includes discontinued operations) S Diluted Weighted Average Shares Dividends per Share Diluted Normalized EPS (continuing operations) Cash Cycle Revenue per day Accounts Receivable Receivable Days Inventory Inventory Days Accounts Payable Payable Days Cash Cycle (days) Key Ratios Market Value of Book Equity Price per share* Earnings per share (continuing operations) P/E Ratio Return on Invested Capital Return on Assets McDonald's Financial Analysis Return on Equity Return on Revenue Total Assets Current Assets Current Liabilities Current Ratio Total Liabilities Liabilities/Equity Ratio Total Equity (book value) Shareholders' Equity (minority interests) Market to Book Value Per Employee Number of Employees (continuing operations) Revenue Net Income Market Value FY 2010 2,70,06,000 $2,40,74,600 1,49,89,800 1,20,16,200 0.44 82,92,900 25,09,100 57,83,800 55.03.100 S 10,44,900 2.53 5.27 FY 2011 73,989 13,34,700 18 1,16,800 2 9,61,300 13 7 FY 2011 10,48,34,817 100.33 5.27 19.04 0.18 0.17 0.38 0.20 3,29,89,900 44,03,000 35,09,200 1.25 1,85,99,700.0 1.29 1,43,90,200.0 7.29 FY 2011 420.0 64 13 250 *Stock price obtained from Yahoo Finance at close of final day of FY 1,32,36,900 1,08,37,700 0.45 73,04,000 20,54,000 52,50,000 49.46.300 S 10,80,300 2.26 4.58 FY 2010 65,958 11,79,100 18 1,09,900 2 9,43,900 14 5 FY 2010 8,29,23,828 76.76 4.58 16.76 0.16 0.15 0.34 0.21 3,19,75,200 43,68,500 29,24,700 1.49 1.18 1,46,34,200.0 FY 2010 5.67 FY 2009 FY 2008 $ 2,27,44,700 $ 2,35,22,400 1,27,92,100 1,37,21,600 99,52,600 98,00,800 0.44 0.42 65,57,600 62,83,700 19,36,000 18,44,800 46,21,600 44,38,900 43.13.200 45.51.000 S 400.0 60 12 207 11,07,400 2.05 4.11 FY 2009 62,314 10,60,400 17 1,06,200 1,73,41,000.0 1,61,91,000.0 2 6,36,000 10 9 FY 2009 6,91,46,056 62.44 4.11 15.19 0.15 0.15 0.32 0.20 3,02,24,900 34,16,300 29,88,700 1.14 1.15 1,40,33,900.0 4.93 FY 2009 385.0 59 12 180 11,46,000 1.63 3.76 FY 2008 64,445 9,31,200 14 1,11,500 2 6,20,400 10 7 FY 2008 7,12,69,740 62.19 3.76 16.54 0.16 0.15 0.32 0.18 2,84,61,500 35,17,600 25,37,900 1.39 1,50,78,900.0 1.13 1,33,82,600.0 5.33 FY 2008 400.0 59 11 178 (data in thousands [000], excluding per share data and financial ratios) FY 2012 Revenue Cost of Revenue Gross Profit Gross Profit Margin EBIT Income Tax NOPAT (Net Operating Profit After Taxes) Net Income (includes discontinued operations) S Diluted Weighted Average Shares Dividends per Share Diluted Normalized EPS (continuing operations) Cash Cycle Revenue per day Accounts Receivable Receivable Days Inventory Inventory Days Accounts Payable Payable Days Cash Cycle (days) Key Ratios Market Value of Equity Price per share P/E Ratio Return on Invested Capital Return on Assets Return on Equity Return on Revenue Total Assets Current Assets Current Liabilities Current Ratio Total Liabilities Liabilities/Equity Ratio Total Equity (book value) Shareholders' equity (minority interests) Market to Book Value Per Employee Number of Employees Revenue $ Net Income Market Value Competitor Financial Analysis McDonald's 2,75,67,000 $ 1,53,48,500 1,22,18,500 0.44 83,61,100 26,14,200 57,46,900 54.64.800 S 10,20,200 2.87 5.36 McDonald's 75,526 13,75,300 18 1,21,700 2 11,41,900 15 5 McDonald's 8,99,91,842 88.21 16.46 0.16 0.15 0.36 0.20 3,53,86,500 49,22,100 34,03,100 1.45 2,00,92,900 1.31 1,52,93,600 5.88 McDonald's 440.000 63 12 205 *Stock price obtained from Yahoo Finance at close of final day of FY Subway Restaurants is privately held Taco Bell is owned by Yum! Brands Burger King Dunkin' Donuts 19,66,300 $ 6,58,181 10,26,500 1,44,224 5,13,957 9,39,800 0.48 0.78 4,98,000 42,000 4,56,000 1.17.700 S 3,54,100 0.04 0.33 Burger King 5,387 1,79,000 33 6,700 1 68,700 13 22 Burger King 58,21,404 16.44 49.82 0.08 0.02 0.10 0.06 55,64,000 8,90,500 3,97,800 2.24 43,89,000 3.74 11,75,000 4.95 Burger King 10.870 181 11 536 2,57,863 54,377 2,03,486 1.08.308 S 1,16,573 0.60 0.93 Dunkin' Donuts 1,803 53,056 29 - 16,256 9 20 Dunkin' Donuts 37,71,137 32.35 34.78 0.06 0.03 0.31 0.16 32,17,513 4,19,780 3,53,515 1.19 28,67,538 8.27 3,46,651 10.88 Starbucks Yum! Brands $ 1,32,99,500 $ 1,36,33,000 $ 1,01,61,300 31,38,200 0.24 92,12,000 44,21,000 0.32 17,86,700 22,02,000 6,74,400 5,37,000 11,12,300 16,65,000 13.83.800 S 15.97.000 S Dunkin' Donuts 1.104 596 98 3,416 7,73,000 0.68 1.79 Starbucks 36,437 4,85,900 13 12,41,500 34 3,98,100 11 36 Starbucks 3,91,98,830 50.71 28.33 0.14 0.17 0.27 0.10 82,19,200 41,99,600 22,09,800 1.90 31,04,700 0.61 51,09,000 7.67 Starbucks 160.000 83 9 245 4,73,000 1.19 3.38 Yum! Brands 37,351 3,56,000 10 3,13,000 8 6,84,000 18 (0) Yum! Brands 3,06,12,560 64.72 19.15 0.19 0.18 0.74 0.12 90,11,000 19,09,000 21,88,000 0.87 66,99,000 3.11 21,54,000 59,000.00 14.21 Yum! Brands 523.000 26 3 59 Wendy's 25,05,242 18,81,248 6,23,994 0.25 1,89,210 (21,083) 2,10,293 7,083 3,92,140 0.10 0.02 Wendy's 6,864 61,164 9 13,805 2 70,826 10 1 Wendy's 18,54,822 4.73 236.50 0.05 0.00 0.00 0.00 43,03,199 7,09,827 2,86,862 2.47 23,17,344 1.17 19,85,855 0.93 Wendy's 44.000 57 0 42
Step by Step Solution
3.39 Rating (143 Votes )
There are 3 Steps involved in it
Lets calculate the missing values for McDonalds Financial Analysis for FY 2012 Step 1 Calculate Gros... View full answer

Get step-by-step solutions from verified subject matter experts