

Visit the Australian Stock Exchange website, www.asx.com.au and from ?Prices and research? drop-down menu, select ?Charting?. Type
Question:
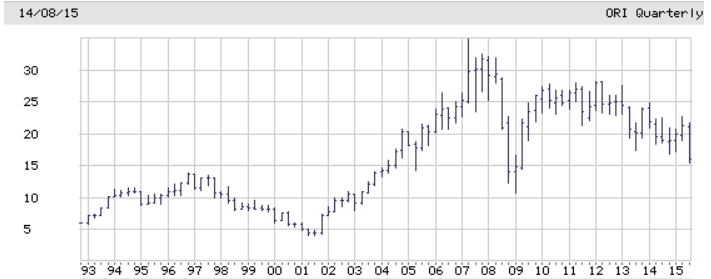
Visit the Australian Stock Exchange website, www.asx.com.au and from ?Prices and research? drop-down menu, select ?Charting?. Type in the ASX code ?ORI? (Orica Limited), select OLHC Bar, and Timeframe ?Monthly prices over 10 years? Click on ?Create chart?. After you create the chart, read the values in the beginning of every Quarter (January, April, July, October) for every year from 2001 to 2014. (ASX information may be incomplete and the values adjusted, not original, which will give you at most 60 percent marks. Read the note below if you wish to score higher marks.)
(a) List all the values in a table and then construct a stem-and-leaf display for the data.
(b) Construct a relative frequency histogram for these data with equal class intervals, the first class being ?$0 to less than $5?.
(c) Briefly describe what the histogram and the stem-and-leaf display tell you about the data. What effects would there be if the interval size is doubled, which means the first class will be ?$0 to less than $10??
(d) What proportion of stock prices were above $25?
(To get more accurate values you will need to search the Internet ? it is part of the assignment task to test your ability to find the correct information. If you use Etrade Australia, for example, as given in the figure below, use the opening price for the given quarter, which is the whisker to the left of each bar. For higher accuracy, use the interactive chart, and as you move the cursor in the interactive chart, the values will display in dollars and cents at the top.)
Expert Answer:
a List all the values in a table and then construct a stemandleaf display for the data 1 mark I incl... View the full answer


Accounting Business Reporting for Decision Making
ISBN: 9780730302414
4th edition
Authors: Jacqueline Birt, Keryn Chalmers, Albie Brooks, Suzanne Byrne, Judy Oliver
