

Question: Write a Team project report with Inferential Statistics and derived insights, according to the BADIR framework. Inferential statistics insights for our airplane data. Mean 2.884
Write a Team project report with Inferential Statistics and derived insights, according to the BADIR framework.
Inferential statistics insights for our airplane data.
| Mean | 2.884 |
| Standard Error | 0.0729939 |
| Standard Deviation | 0.3264385 |
| Sample Variance | 0.1065621 |
| Range | 1.32 |
| Minimum | 2.24 |
| Maximum | 3.56 |
| Confidence Level(95.0%) | 0.1527779 |
| Lower Limit | 2.73122207 |
| Upper Limit | 3.0367779 |
| Time Ranges | Frequency | Frequency % |
|
| 1 | 5% |
| 2.26-2.5 | 1 | 5% |
| 2.51-2.75 | 5 | 25% |
| 2.76-3.00 | 7 | 35% |
| 3.01-3.25 | 3 | 15% |
| 3.26-3.5 | 2 | 10% |
| 3.5 | 1 | 5% |
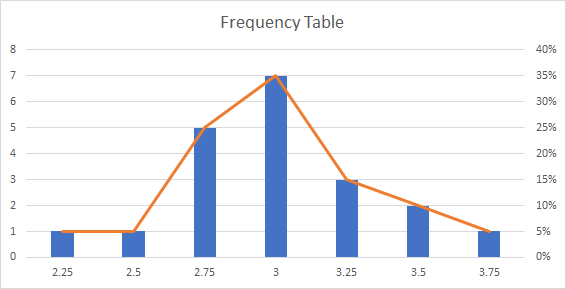
8 7 6 5 4 3 2 0 2.25 2.5 2.75 Frequency Table 3 3.25 3.5 3.75 40% 35% 30% 25% 20% 15% 10% 5% 0%
Step by Step Solution
3.46 Rating (153 Votes )
There are 3 Steps involved in it
Team Project Report Inferential Statistics Insights from Airplane Data using the BADIR Framework Background The project aims to analyze the provided a... View full answer

Get step-by-step solutions from verified subject matter experts