

Your supervisor dumped a box of sales information regarding your company and then asked you to make
Question:
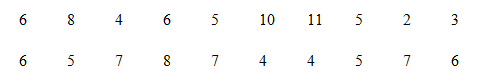
Your supervisor dumped a box of sales information regarding your company and then asked you to make sense of it. You went through the information and compiled the following list of this year's weekly sales (in $1,000's). Your job now is to organize and summarize the information.
a. using the raw data, what is the
1) Mean,
2) Median,
3) Mode,
4) Range,
5) Variance and standard deviation?
b. Construct a
1) Histogram,
2) Frequency polygon,
3) More-than cumulative frequency polygon.
c. Comment on the shape of the distribution. Use statistical analyses to support your comments.
d. Ignore part ?c? above and assume the data are normally distributed. Based on this assumption, approximately 95% of your organization?s sales were between $_____ and $_______ (use the Empirical Rule).
e. What conclusions might one draw from this information?
Expert Answer:
Be sure to show all work I am not able to award partial credit for wrong answers with no supporting computations a using the raw data what is the 1 Me... View the full answer


College Accounting
ISBN: 978-1111528126
11th edition
Authors: Tracie Nobles, Cathy Scott, Douglas McQuaig, Patricia Bille
