

Question: Given the production possibility curve data below: A B C D E Capital Goods Consumer Goods 24 36 44 48 16 12 8 4
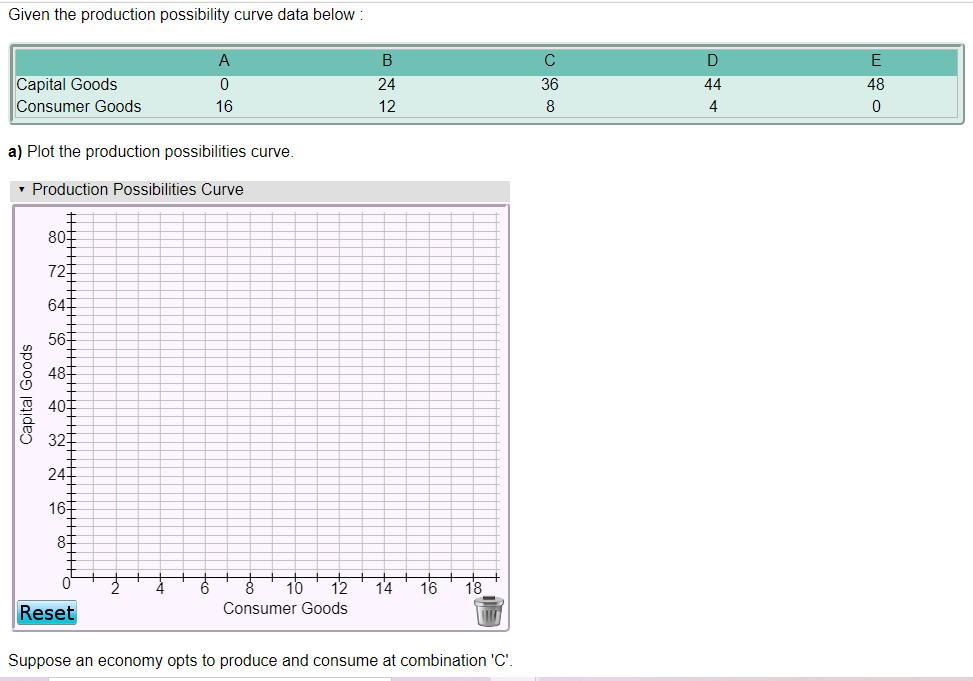
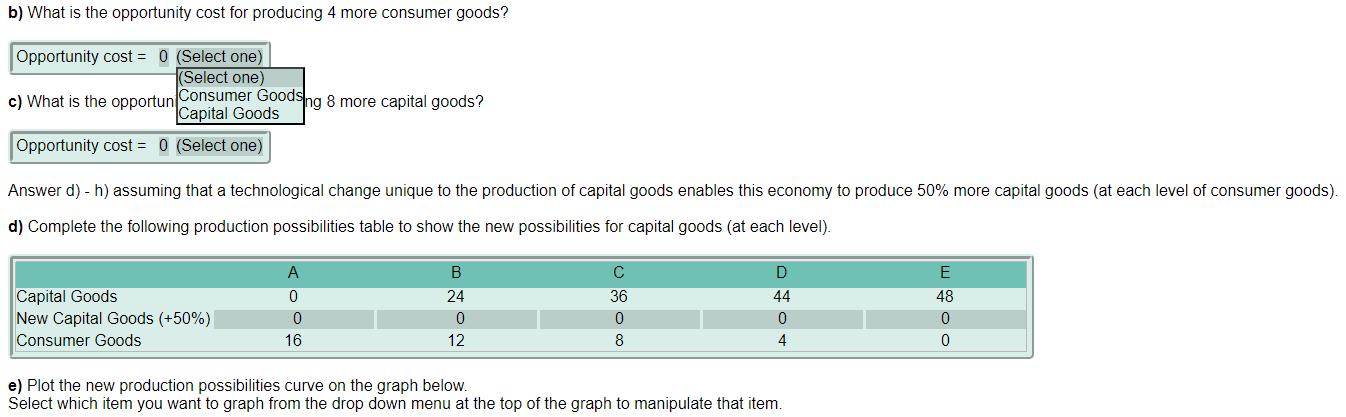
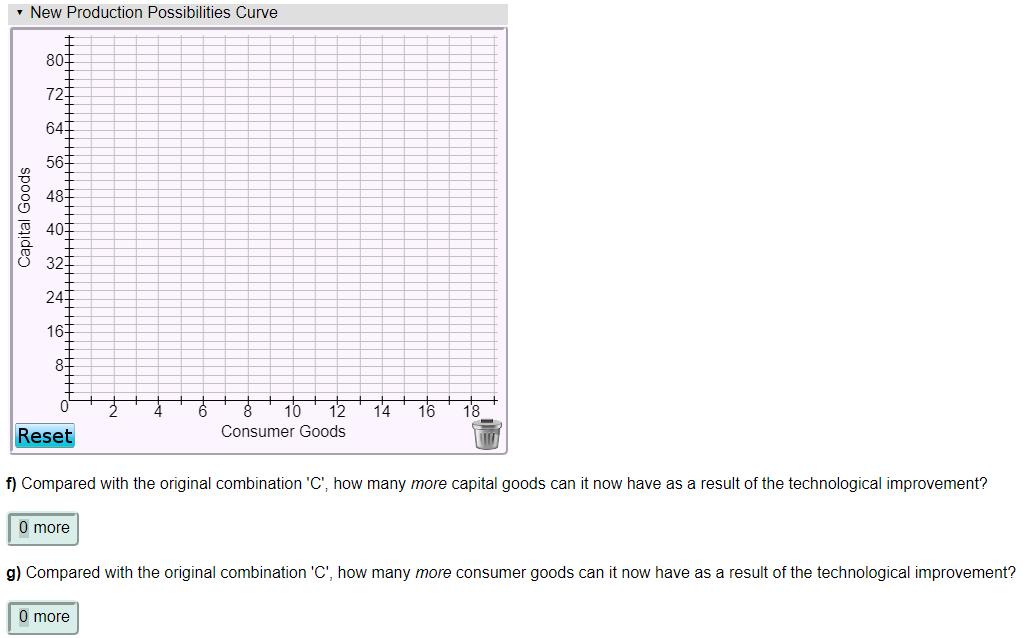

Given the production possibility curve data below: A B C D E Capital Goods Consumer Goods 24 36 44 48 16 12 8 4 a) Plot the production possibilities curve. Production Possibilities Curve 801 72 64 56 481 40 32 24 16 87 12 14 16 18 Reset Consumer Goods Suppose an economy opts to produce and consume at combination 'C'. Capital Goods to b) What is the opportunity cost for producing 4 more consumer goods? Opportunity cost = 0 (Select one) (Select one) c) What is the opportunConsumer Goodshg 8 more capital goods? Capital Goods Opportunity cost = 0 (Select one) Answer d) - h) assuming that a technological change unique to the production of capital goods enables this economy to produce 50% more capital goods (at each level of consumer goods). d) Complete the following production possibilities table to show the new possibilities for capital goods (at each level). A B C E Capital Goods 24 36 44 48 New Capital Goods (+50%) Consumer Goods 16 12 8 4 e) Plot the new production possibilities curve on the graph below. Select which item you want to graph from the drop down menu at the top of the graph to manipulate that item. - New Production Possibilities Curve 801 72 641 56 48- 401 321 24 16- 8 12 14 16 18 Reset Consumer Goods f) Compared with the original combination 'C', how many more capital goods can it now have as a result of the technological improvement? 0 more g) Compared with the original combination 'C', how many more consumer goods can it now have as a result of the technological improvement? 0 more Capital Goods h) Suppose that the economy wishes to have 25% more capital goods than the original combination 'C'. Approximately how many more consumer goods can it have? 0 more
Step by Step Solution
3.48 Rating (155 Votes )
There are 3 Steps involved in it
a The PPC of the given points is shown below The important points A B C D E are marked on the graph ... View full answer

Get step-by-step solutions from verified subject matter experts