

Question: MAKE AN EXCEL SHEET Make a Frequency Distribution with 5 classes, also list the midpoints, relative frequency, and cumulative relative frequency Make a relative frequency
MAKE AN EXCEL SHEET
- Make a Frequency Distribution with 5 classes, also list the midpoints, relative frequency, and cumulative relative frequency
- Make a relative frequency ogive
- Don’t forget descriptive title and labels on x and y axis (ogive is not descriptive, what does the graph represent?)
- Make a frequency polygon
- Don’t forget a descriptive title and labels on x and y axis (polygon is not descriptive, what does the graph represent?)
- Calculate the mean
- Calculate the median
- Calculate the sample standard deviation (our data is sample from our class, not a population!)
- Calculate the Q1 and Q3 values
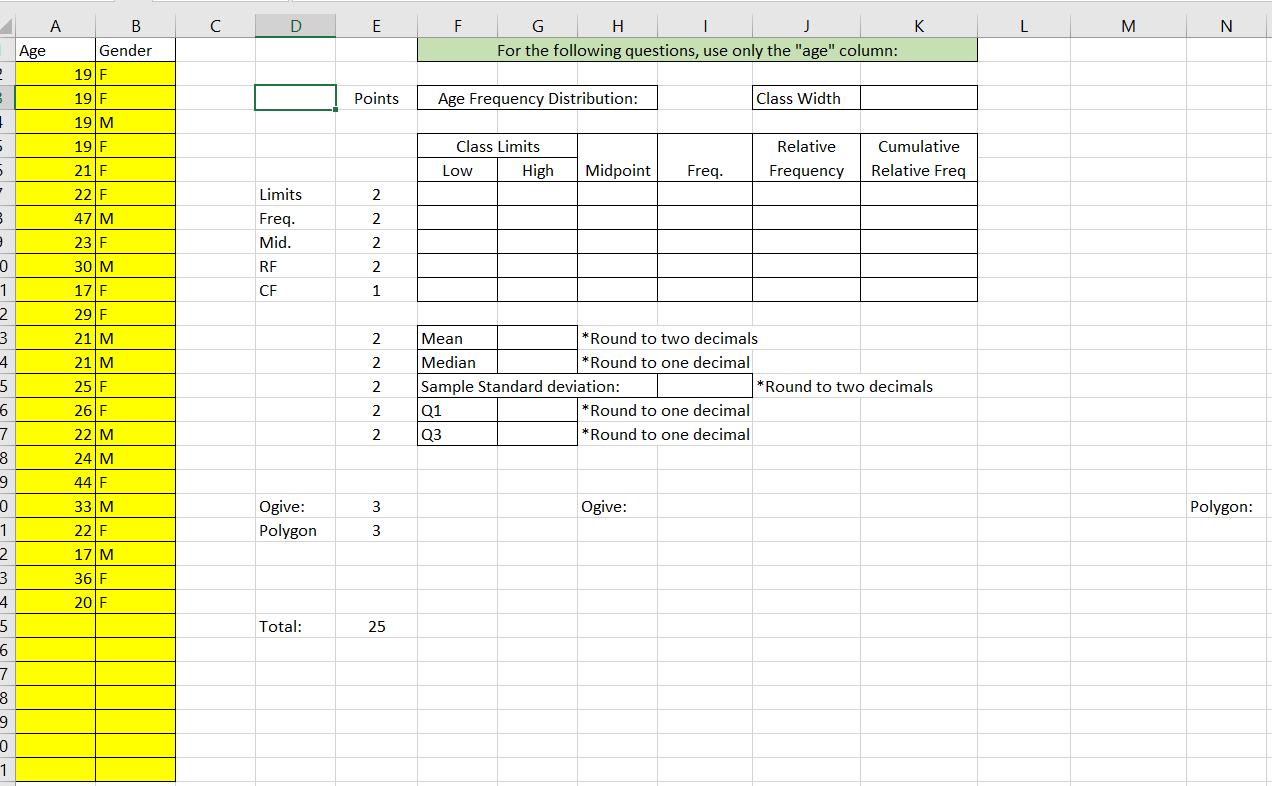
Age A B C D E F Gender G H I J For the following questions, use only the "age" column: K L M N Points Age Frequency Distribution: Class Width Class Limits Low High Midpoint Freq. Relative Frequency Cumulative Relative Freq 2 19 F 3 19 F + 19 M 5 19 F 5 21 F 7 22 F Limits 3 47 M 23 F Freq. Mid. 0 30 M RF 1 17 F CF 2 29 F 3 21 M 4 21 M 5 25 F 6 26 F 7 22 M 22221 22222 8 24 M 9 44 F 0 33 M 1 22 F Ogive: Polygon 3 3 2 17 M 3 36 F 4 20 F 5 Total: 25 6 7 8 9 0 1 Mean Median Sample Standard deviation: *Round to two decimals *Round to one decimal *Round to two decimals Q1 Q3 *Round to one decimal *Round to one decimal Ogive: Polygon:
Step by Step Solution
There are 3 Steps involved in it
Lets address each of the questions stepbystep 1 For Example 23 on P 50 create a frequency distribution with 5 classes and using a lowest endpoint value of 100 To create a frequency distribution you ne... View full answer

Get step-by-step solutions from verified subject matter experts