

Question: (a) Draw the production possibility curve for each country using the data provided in the table. (b) Which country has an absolute advantage in what
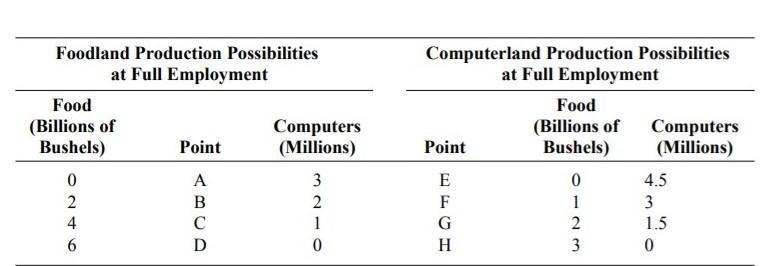
(a) Draw the production possibility curve for each country using the data provided in the table.
(b) Which country has an absolute advantage in what product? Which country has a comparative advantage in what product? Show your work!
(c) Without trade, what is the price of food in terms of computers for both countries? Show your work!
(d) What is the range of prices (i.e., the price line) at which trade can occur? Also, show (a) the possible price lines for each country and (b) the possible production and consumption possibility lines (consumption curve) for both countries after trade. Show your work!
(e) What happened to employment?
Step by Step Solution
There are 3 Steps involved in it

Get step-by-step solutions from verified subject matter experts