

Question: Analysis of investment portfolio returns over a 20-year period showed the statistics below. Click here for the Excel Data File (a) Calculate and compare the
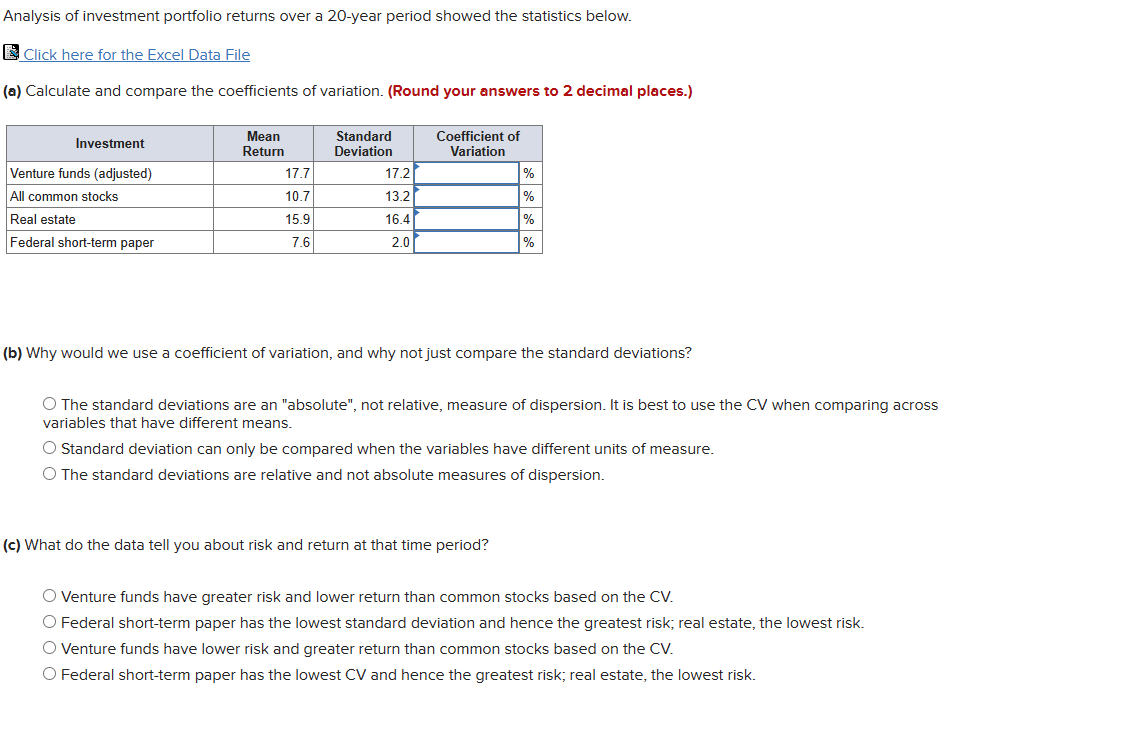
Analysis of investment portfolio returns over a 20-year period showed the statistics below. Click here for the Excel Data File (a) Calculate and compare the coefficients of variation. (Round your answers to 2 decimal places.) TSI Rowm | Deviation | Varation Venture funds (adjusted) 177 All common stocks 107 Real estate 15.9 Federal short-term paper 76 (b) Why would we use a coefficient of variation, and why not just compare the standard deviations? O The standard deviations are an "absolute", not relative, measure of dispersion. It is best to use the CV when comparing across variables that have different means. O Standard deviation can only be compared when the variables have different units of measure. O The standard deviations are relative and not absolute measures of dispersion. (c) What do the data tell you about risk and return at that time period? O Venture funds have greater risk and lower return than common stocks based on the CV. O Federal shori-term paper has the lowest standard deviation and hence the greatest risk; real estate, the lowest risk. O Venture funds have lower risk and greater return than common stocks based on the CV. O Federal short-term paper has the lowest CV and hence the greatest risk; real estate, the lowest risk
Step by Step Solution
There are 3 Steps involved in it

Get step-by-step solutions from verified subject matter experts