

Question: The accompanying table shows time-to-speed data for a particular car accelerating from rest to 120 mph. How far had the car traveled by the
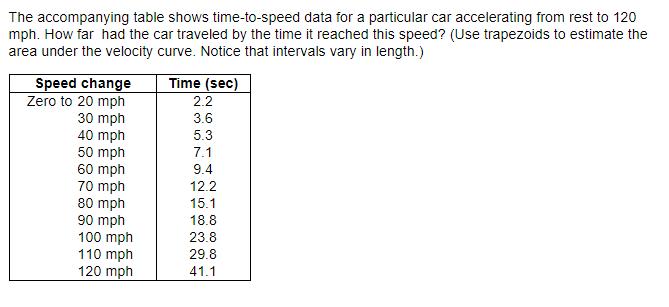
The accompanying table shows time-to-speed data for a particular car accelerating from rest to 120 mph. How far had the car traveled by the time it reached this speed? (Use trapezoids to estimate the area under the velocity curve. Notice that intervals vary in length.) Speed change Zero to 20 mph 30 mph 40 mph 50 mph 60 mph 70 mph 80 mph 90 mph 100 mph 110 mph 120 mph Time (sec) 2.2 3.6 com 5.3 7.1 9.4 12.2 15.1 18.8 23.8 29.8 41.1
Step by Step Solution
★★★★★
3.24 Rating (156 Votes )
There are 3 Steps involved in it
1 Expert Approved Answer
Step: 1 Unlock

Speed time graph is mph poods 120 110 100 70 60 5... View full answer
Question Has Been Solved by an Expert!
Get step-by-step solutions from verified subject matter experts
Step: 2 Unlock
Step: 3 Unlock