

Question: Consider a stretch of road. The relationship between flow and density (called Flow - Density graph) is plotted below: Flow ( 2000 1756 1500
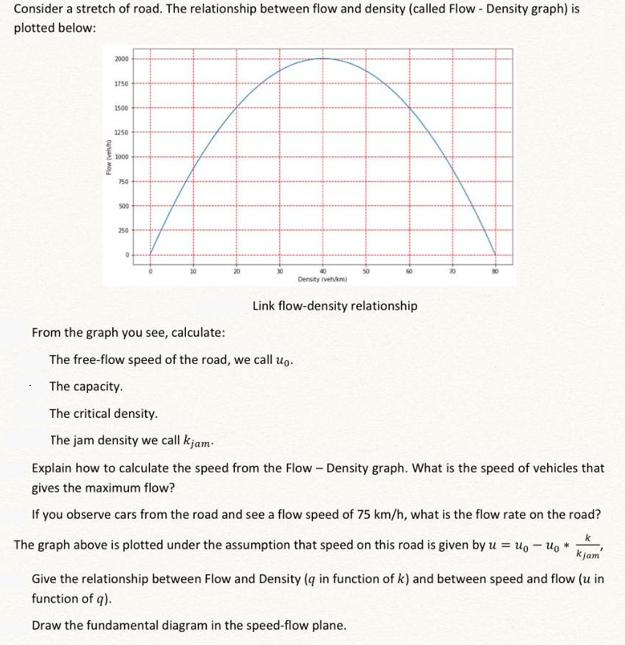
Consider a stretch of road. The relationship between flow and density (called Flow - Density graph) is plotted below: Flow ( 2000 1756 1500 1250 750 500 250 From the graph you see, calculate: The free-flow speed of the road, we call up. The capacity. The critical density. The jam density we call kjam Density velkm) Link flow-density relationship 84 Explain how to calculate the speed from the Flow - Density graph. What is the speed of vehicles that gives the maximum flow? If you observe cars from the road and see a flow speed of 75 km/h, what is the flow rate on the road? The graph above is plotted under the assumption that speed on this road is given by u = uo-up* kjam Give the relationship between Flow and Density (q in function of k) and between speed and flow (u in function of q). Draw the fundamental diagram in the speed-flow plane.
Step by Step Solution
There are 3 Steps involved in it
This graph represents the relationship between traffic flow and density which is crucial for understanding traffic conditions and highway capacity Lets address each question one by one 1 The freeflow ... View full answer

Get step-by-step solutions from verified subject matter experts