

Question: 0 0 Figure 2. Dataset Visualize the reachability distance values in the following figure. 17 V2 0 a bc de fgh ij kImnopqrs From the
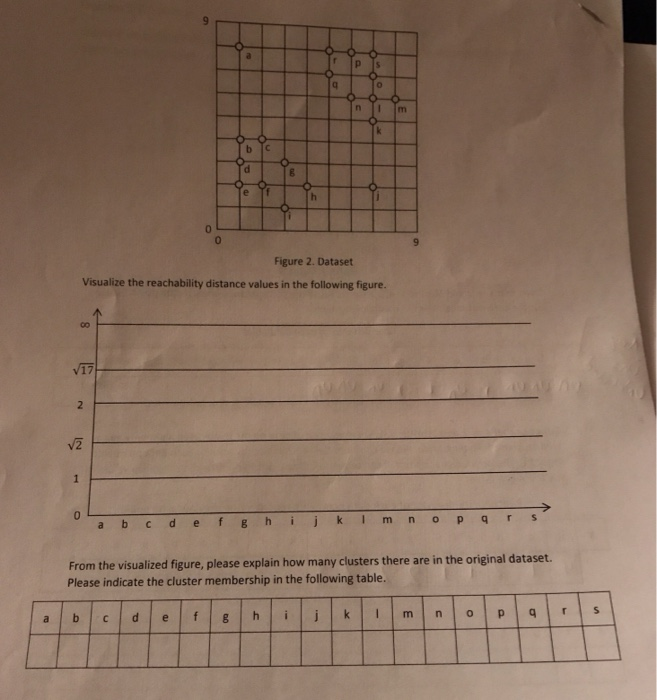
0 0 Figure 2. Dataset Visualize the reachability distance values in the following figure. 17 V2 0 a bc de fgh ij kImnopqrs From the visualized figure, please explain how many clusters there are in the original dataset. Please indicate the cluster membership in the following table
Step by Step Solution
There are 3 Steps involved in it
1 Expert Approved Answer
Step: 1 Unlock

Question Has Been Solved by an Expert!
Get step-by-step solutions from verified subject matter experts
Step: 2 Unlock
Step: 3 Unlock