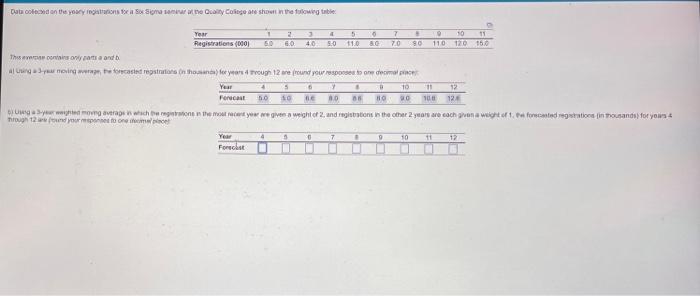
Question: 0 4 50 7 70 40 90 110 Data collection the yeary tatrana sxe a Six Sigma tomar de te cality College are shown in

0 4 50 7 70 40 90 110 Data collection the yeary
0 4 50 7 70 40 90 110 Data collection the yeary tatrana sxe a Six Sigma tomar de te cality College are shown in the following table. Year . 2 5 10 11 Registrations (0001 50 60 110 TO 150 This art and no focaled repstrations on how for years dous 12e round yourselor de Year 4 5 6 10 11 12 Forecast 10 BE 30 BO 90 10 12 Duyong average which wertonnn the cere yow we give a weight of 2 and region is the other 2 years are cachon weight of forected registrations in thousands for your TIN 12 nd your perform Year 4 . 11 12 Forchat 7 9 10

Step by Step Solution

There are 3 Steps involved in it

1 Expert Approved Answer
Step: 1 Unlock blur-text-image
Question Has Been Solved by an Expert!

Get step-by-step solutions from verified subject matter experts

Step: 2 Unlock
Step: 3 Unlock

Students Have Also Explored These Related General Management Questions!