

Question: 0 5 -5 -5 10 dn 5) Is the point (-255, 76) on the line shown below? Justify your answer algebraically. -5Graphing linear equations with
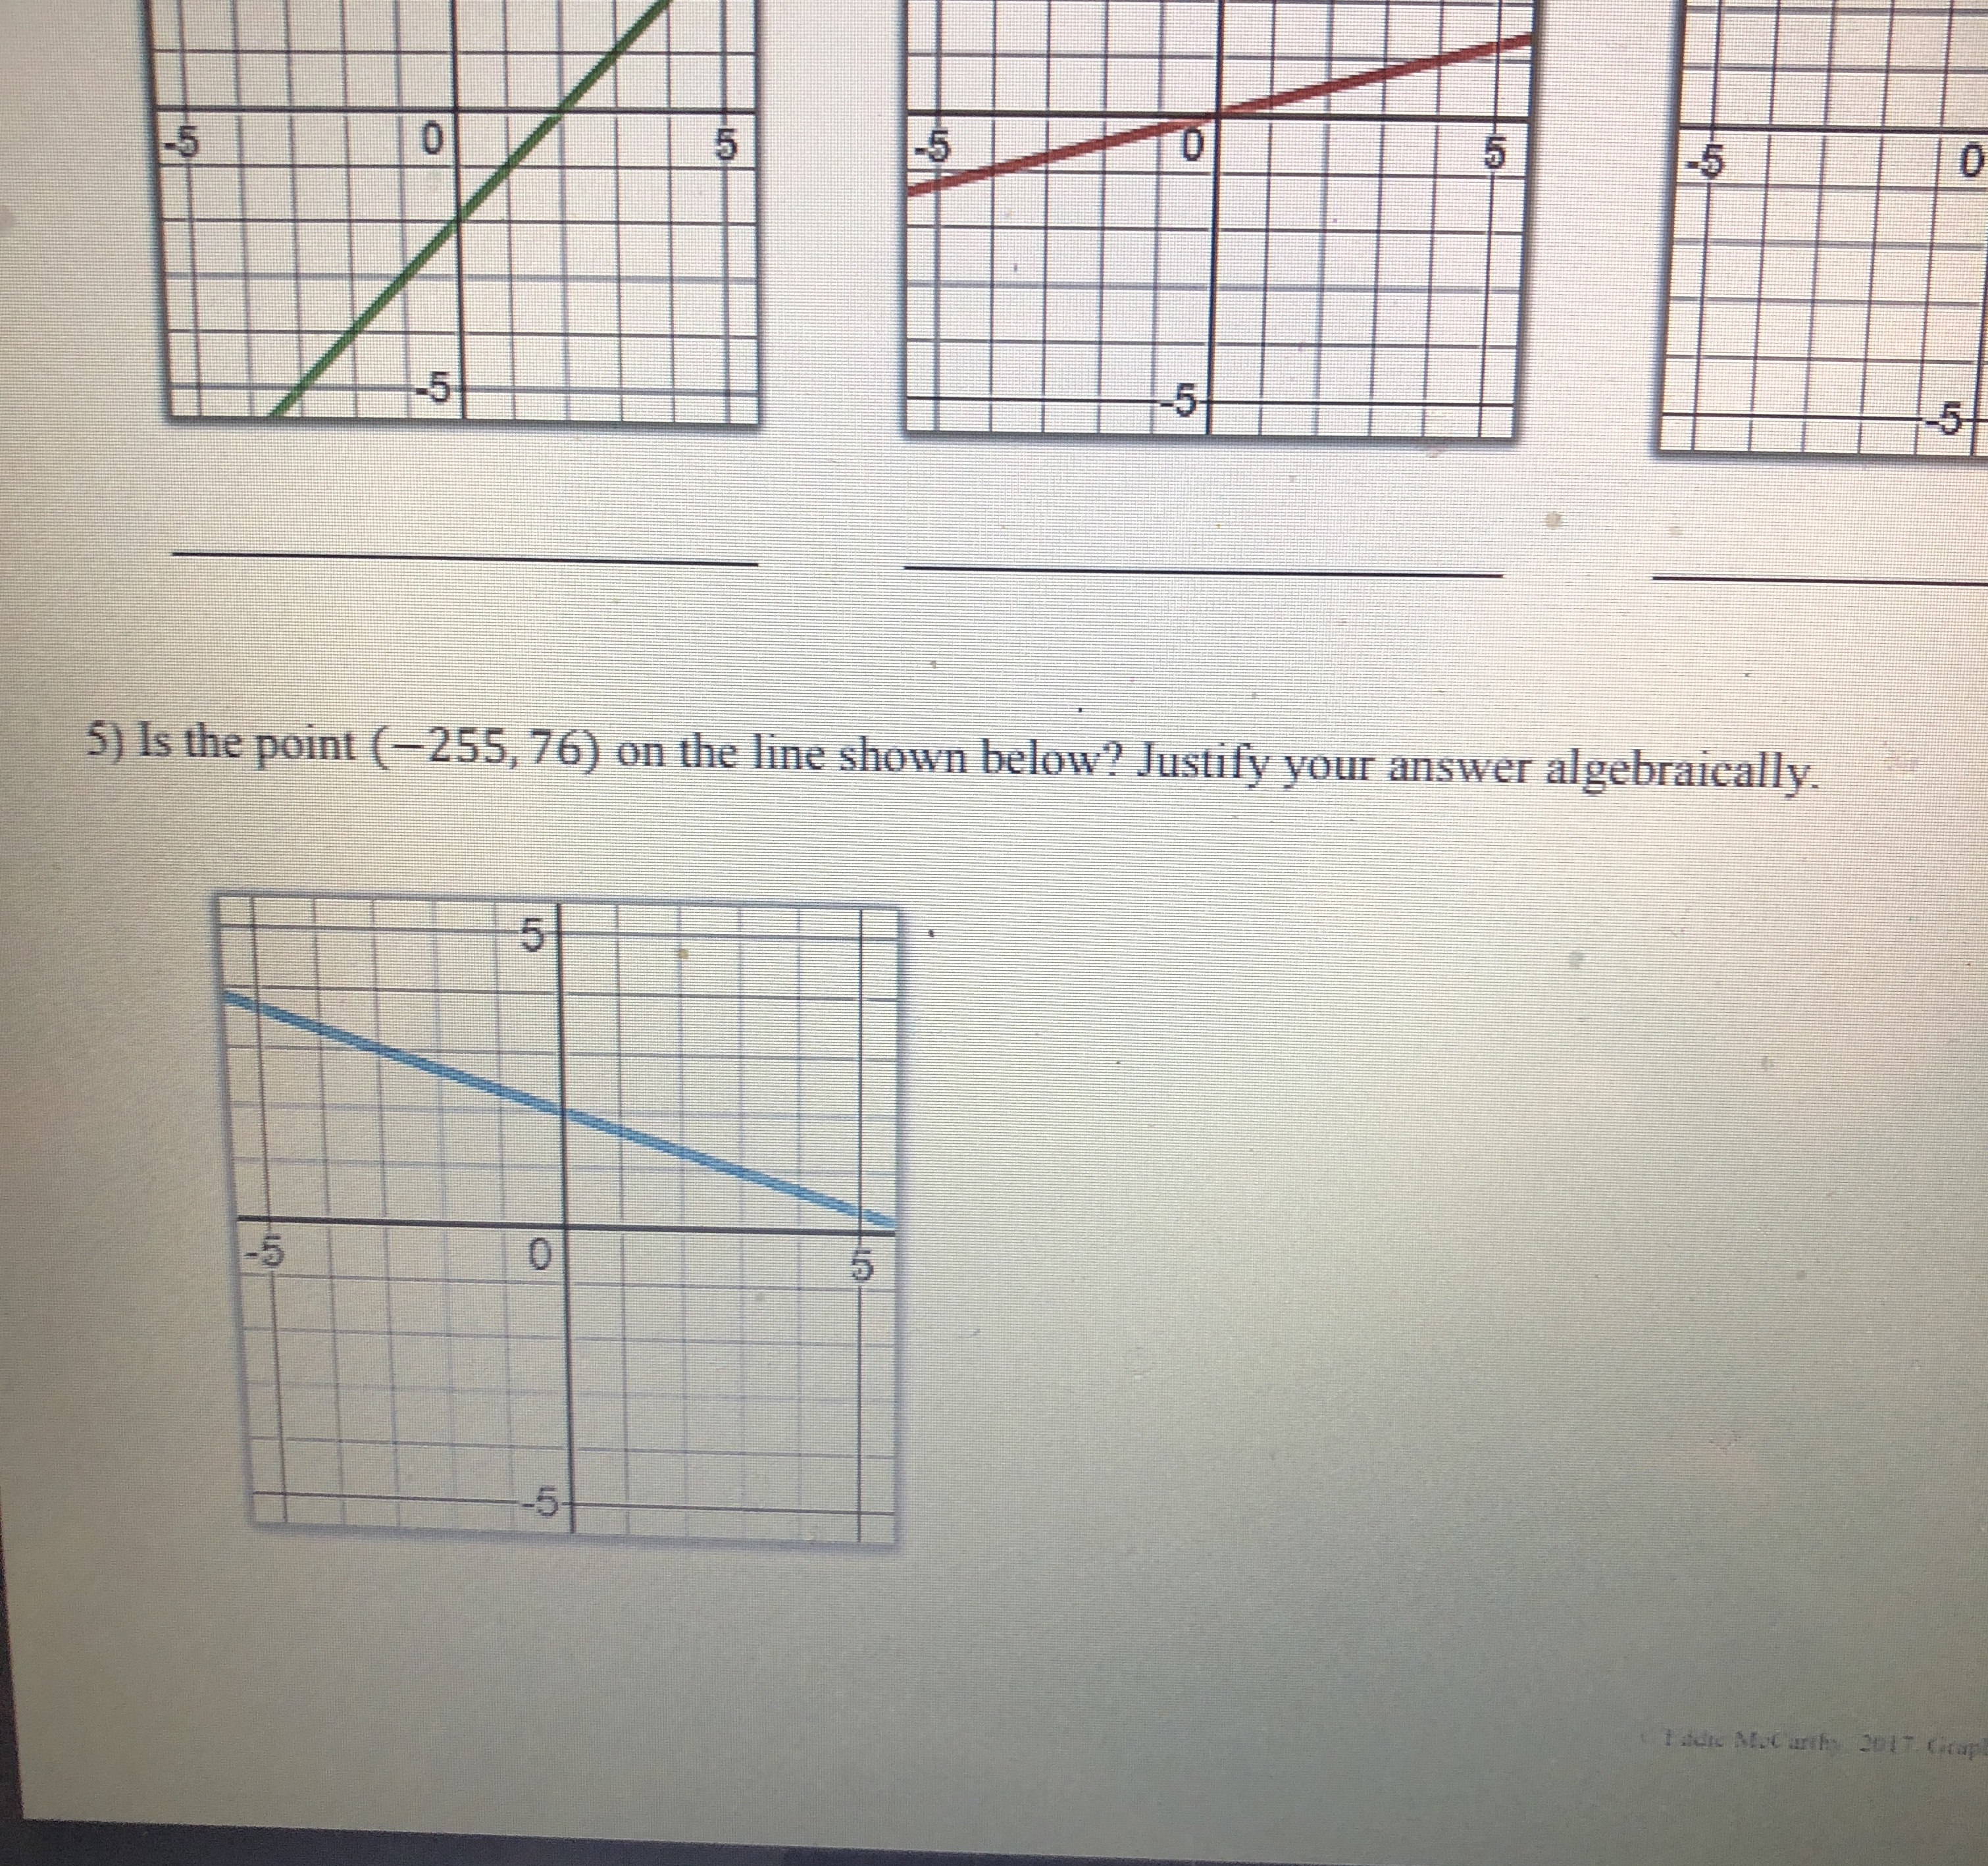
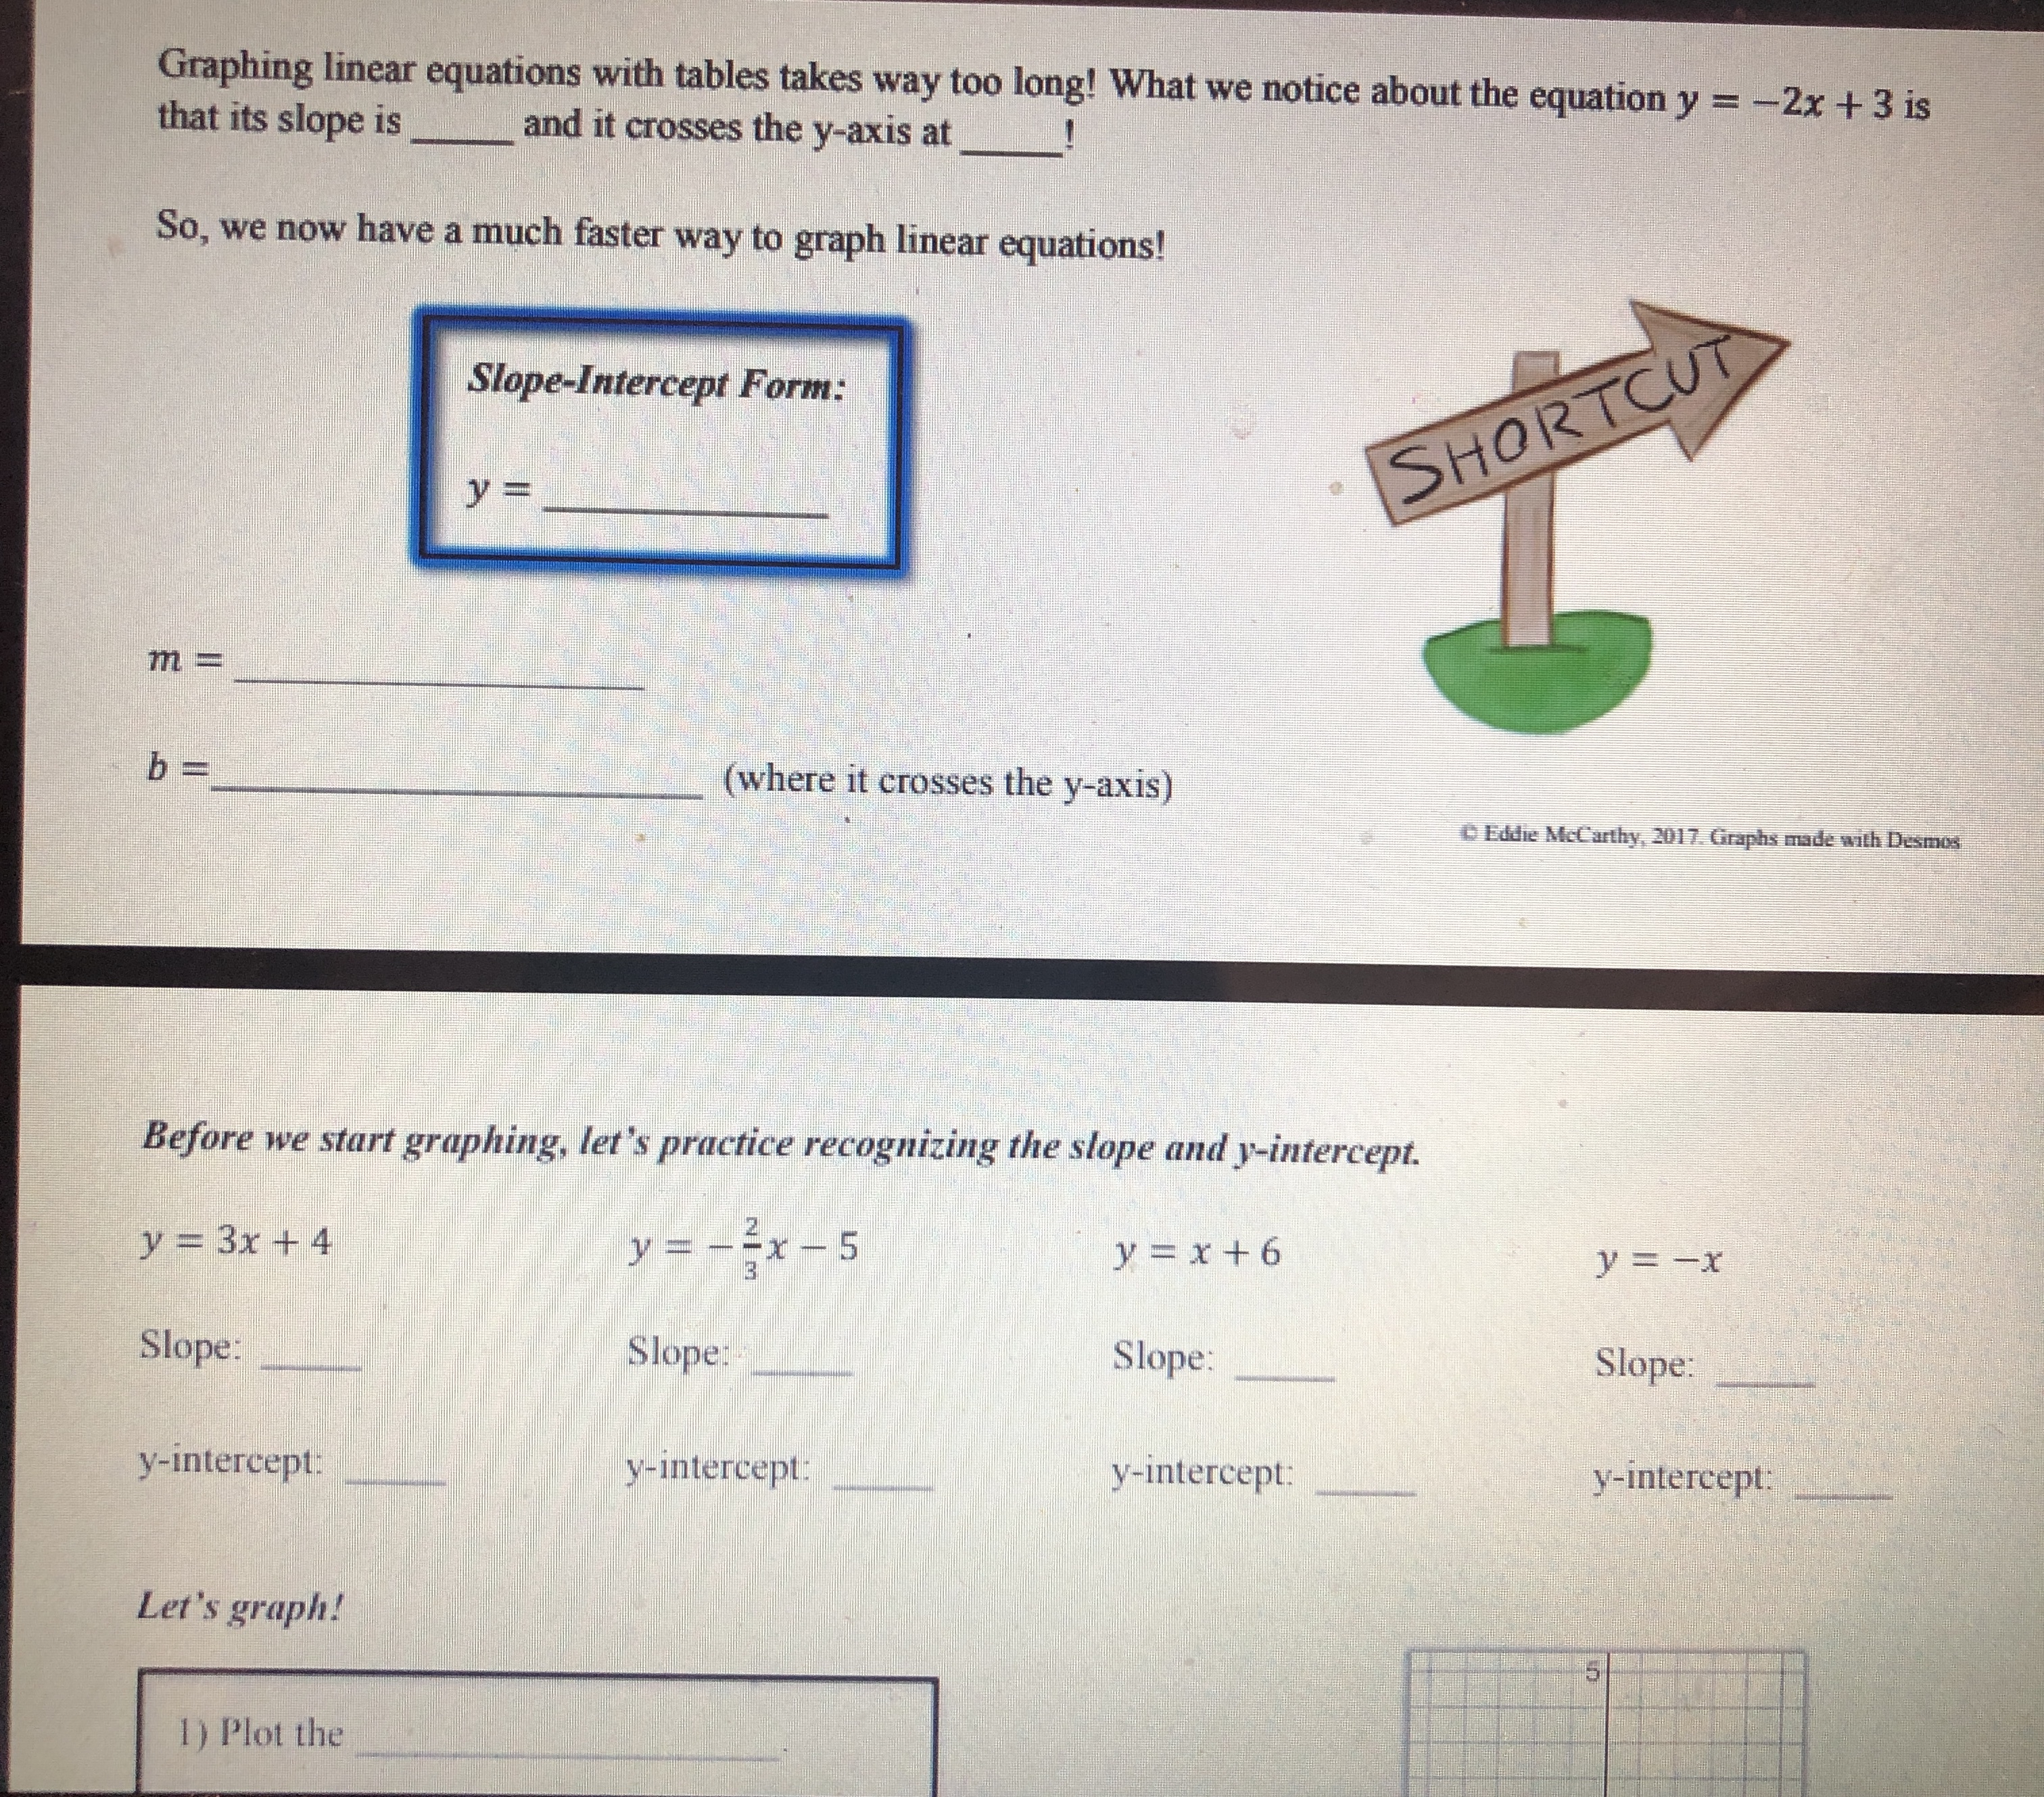
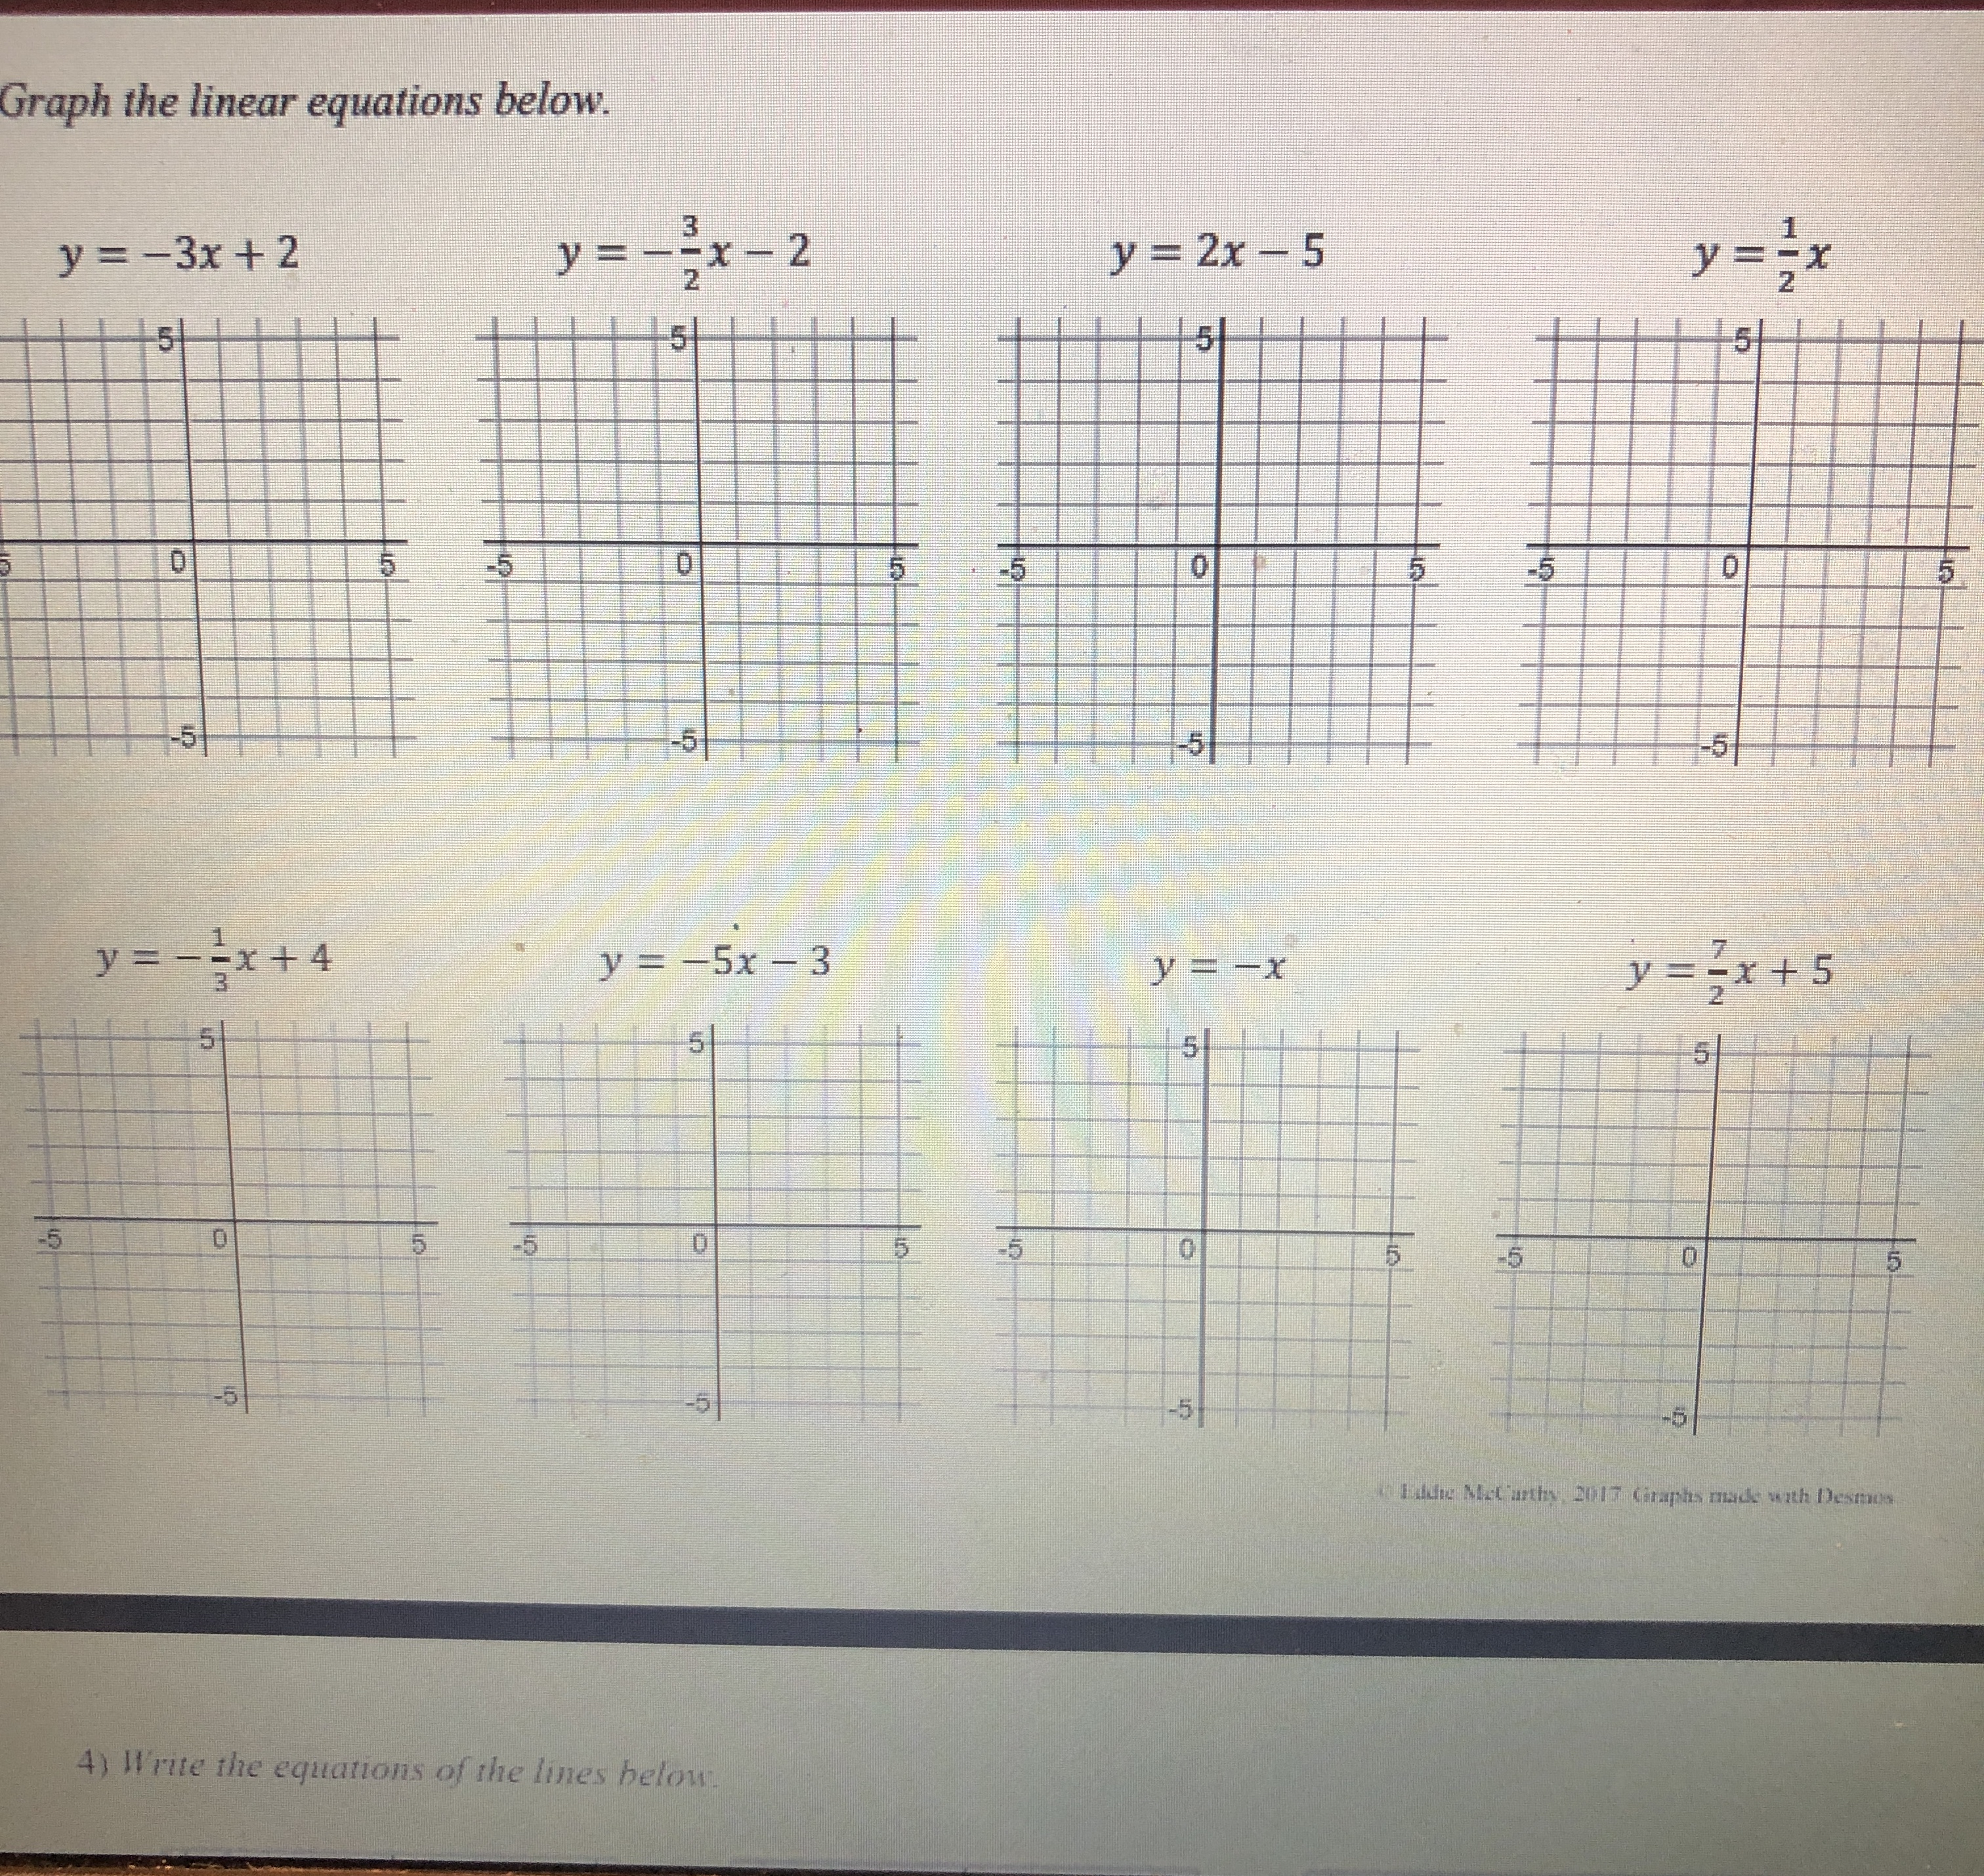
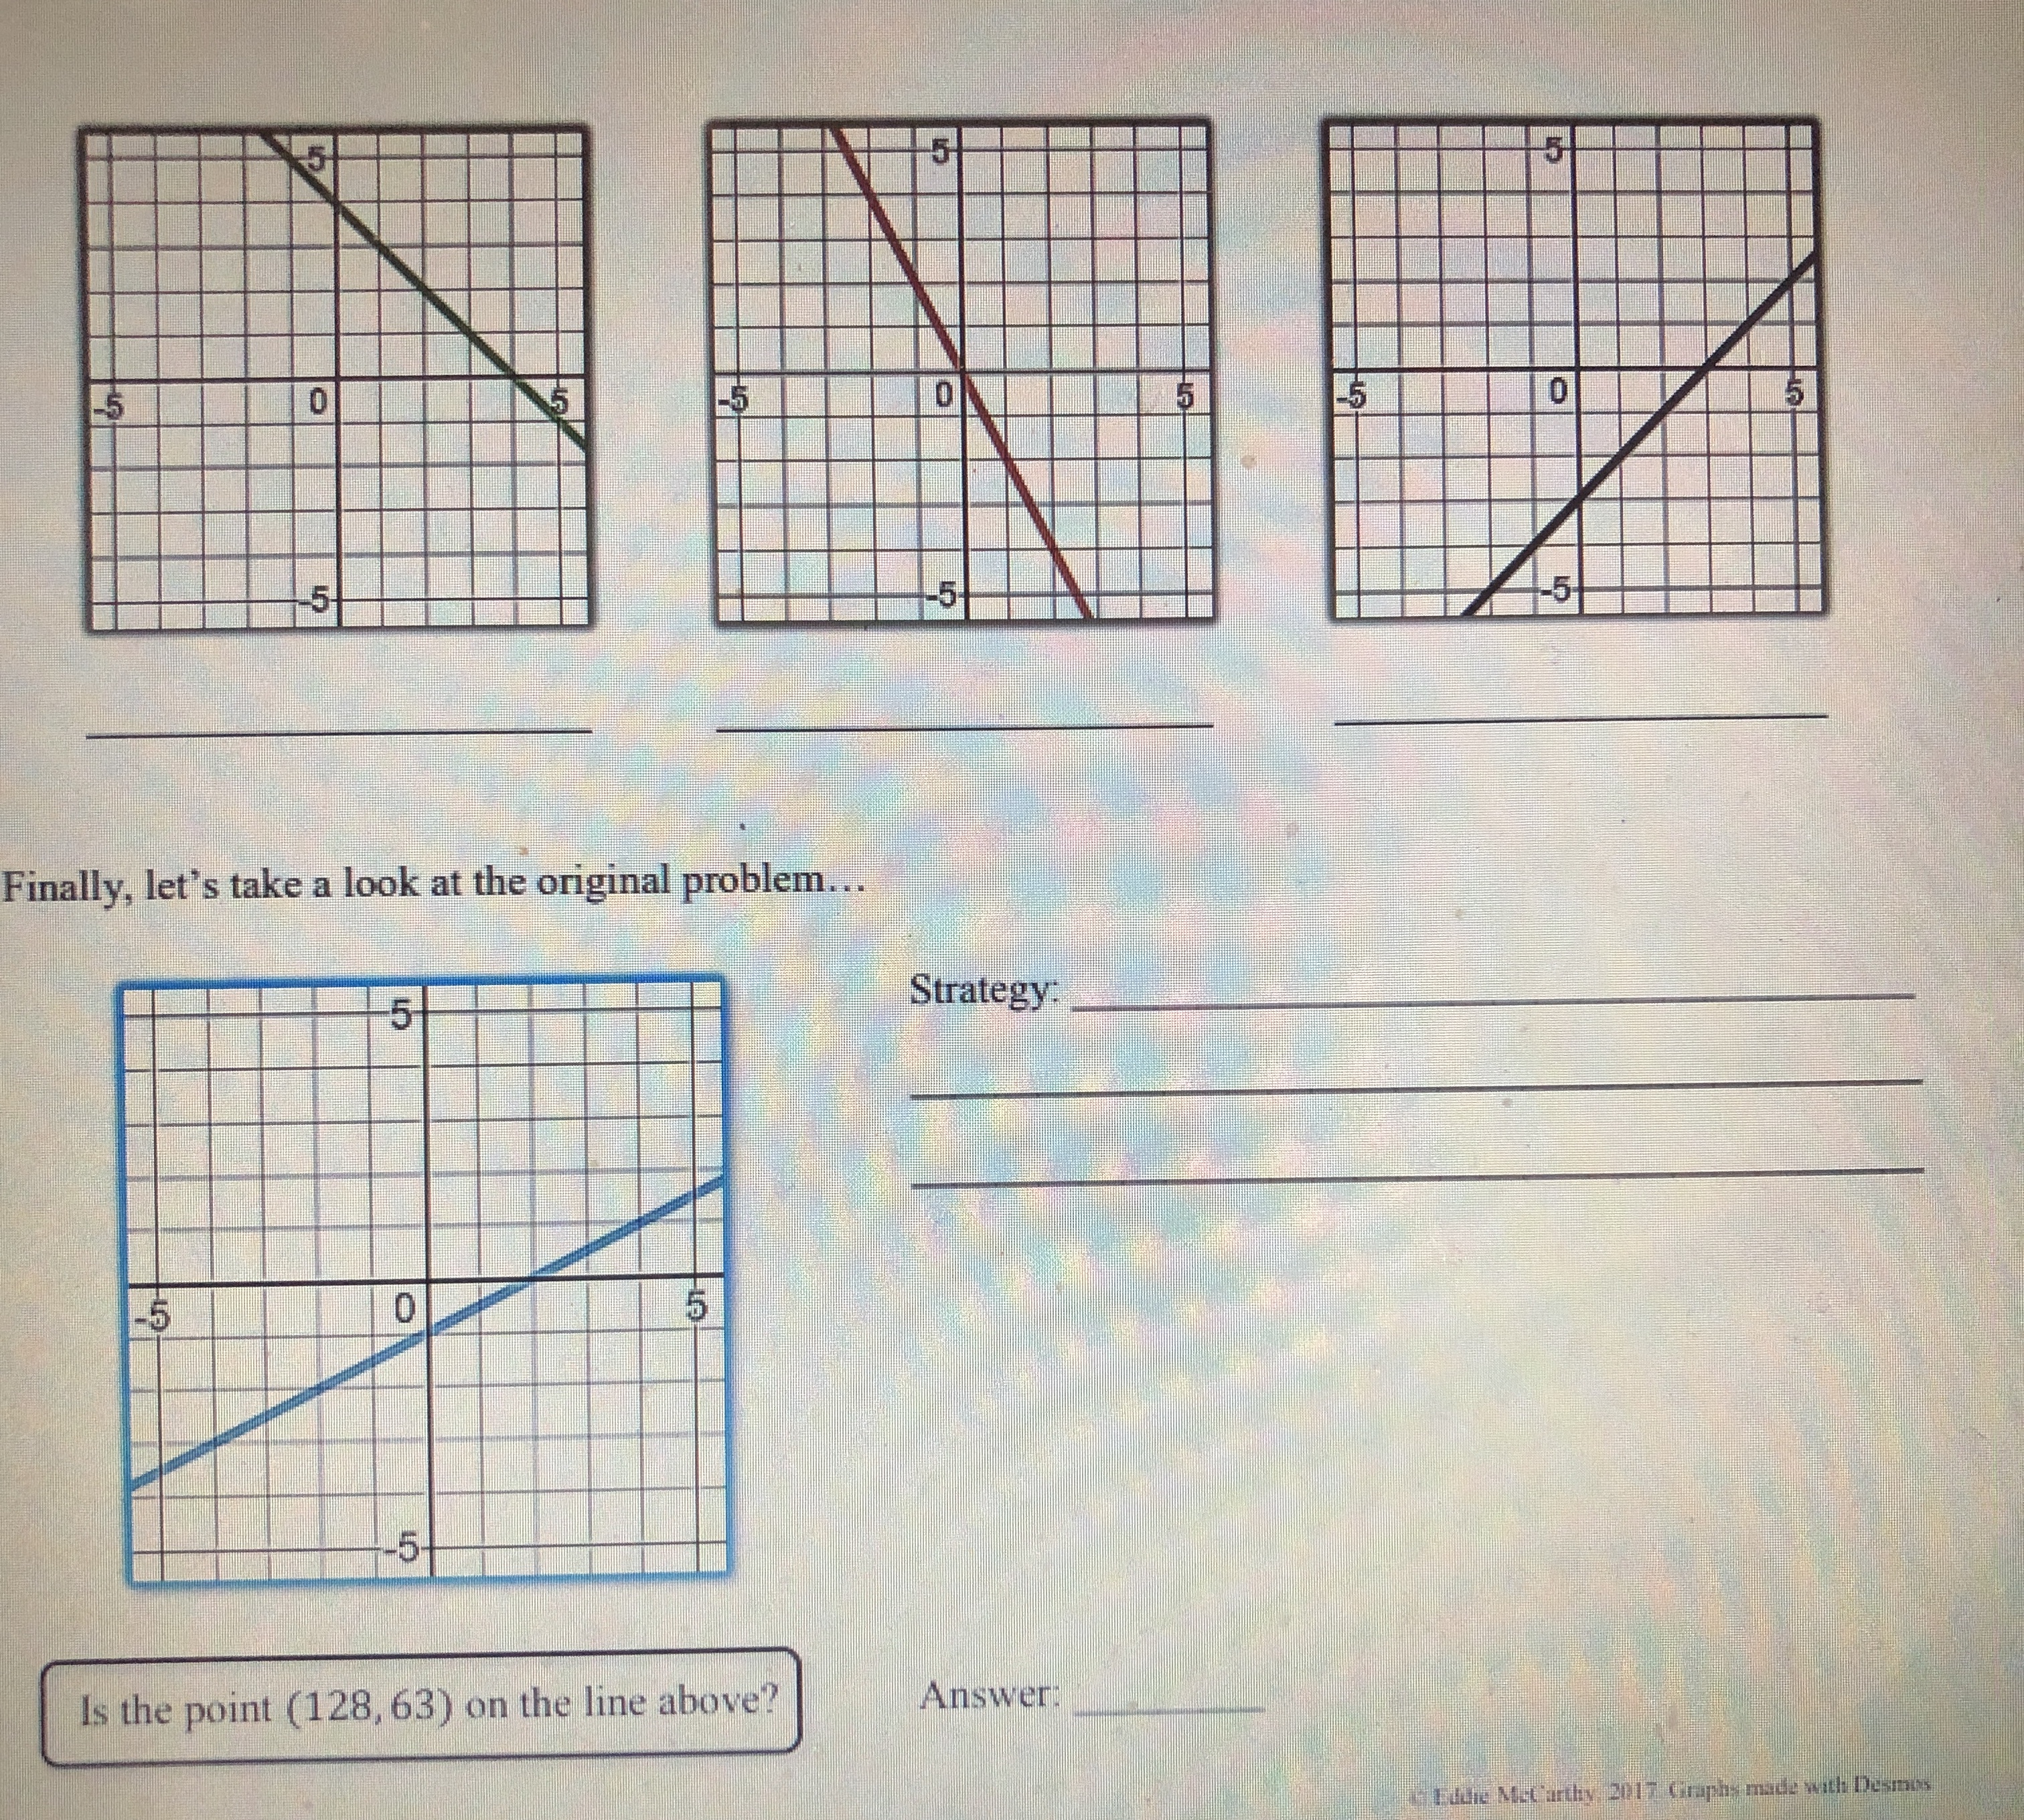
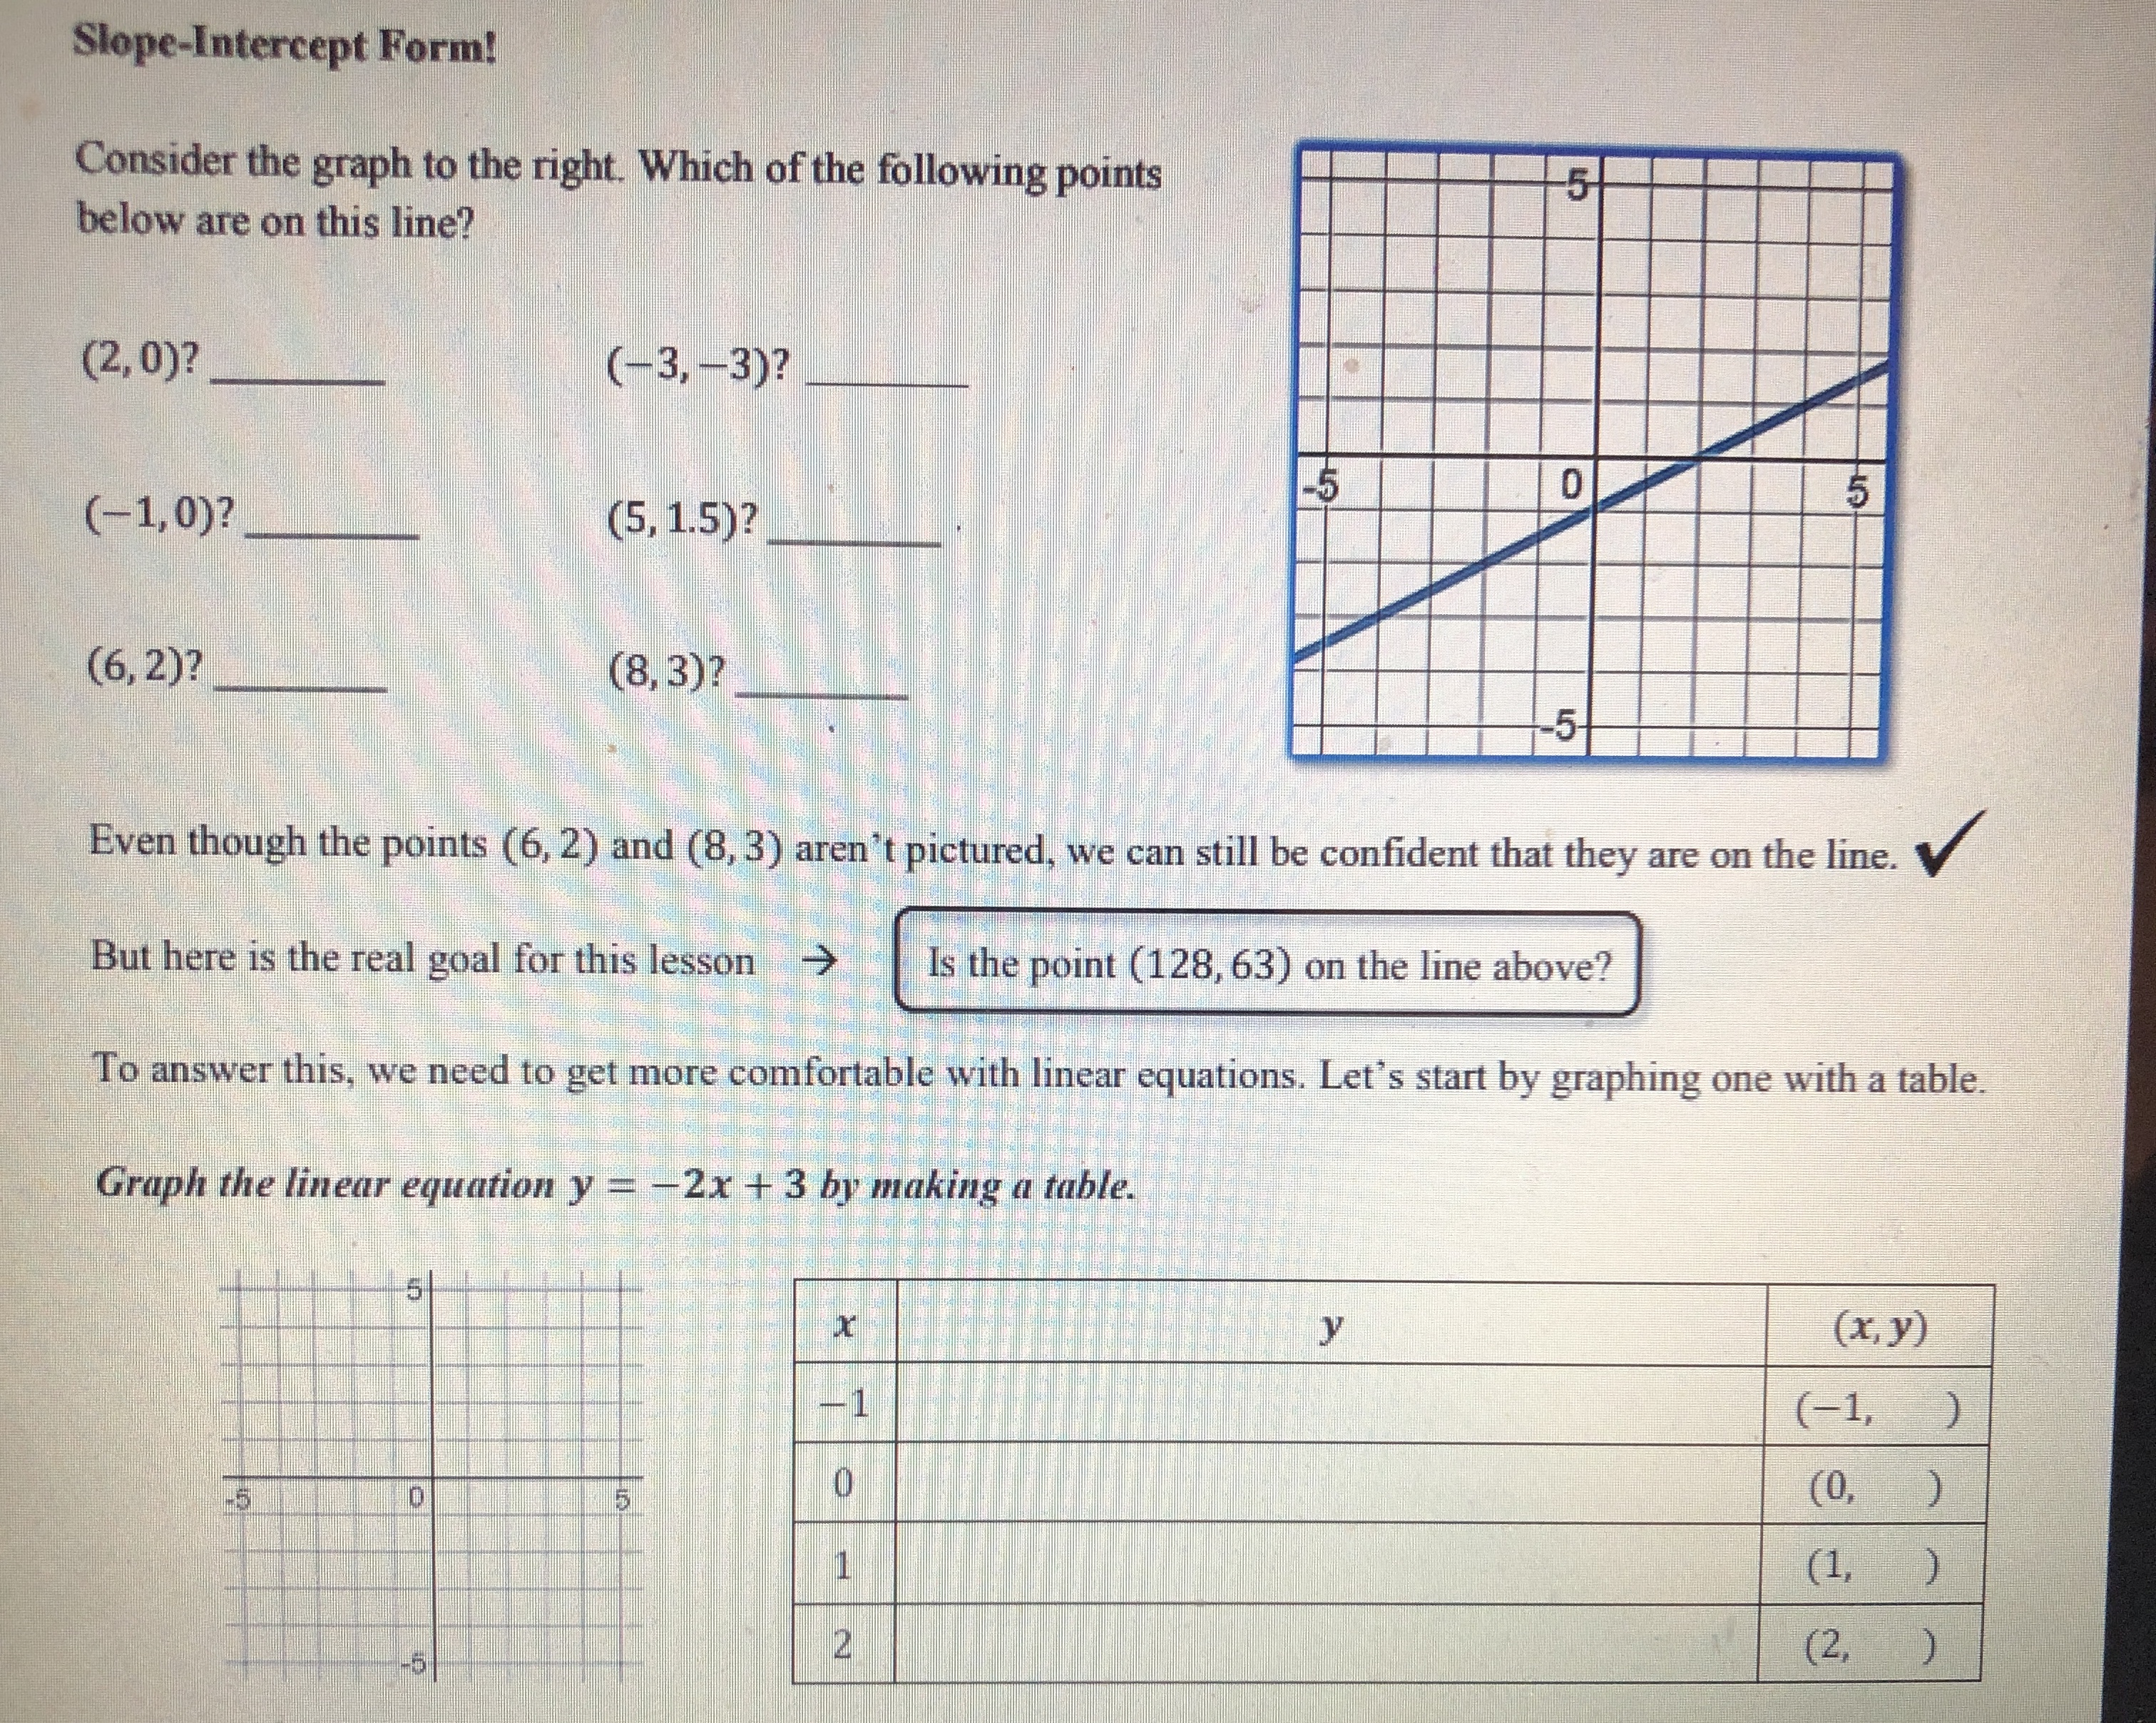
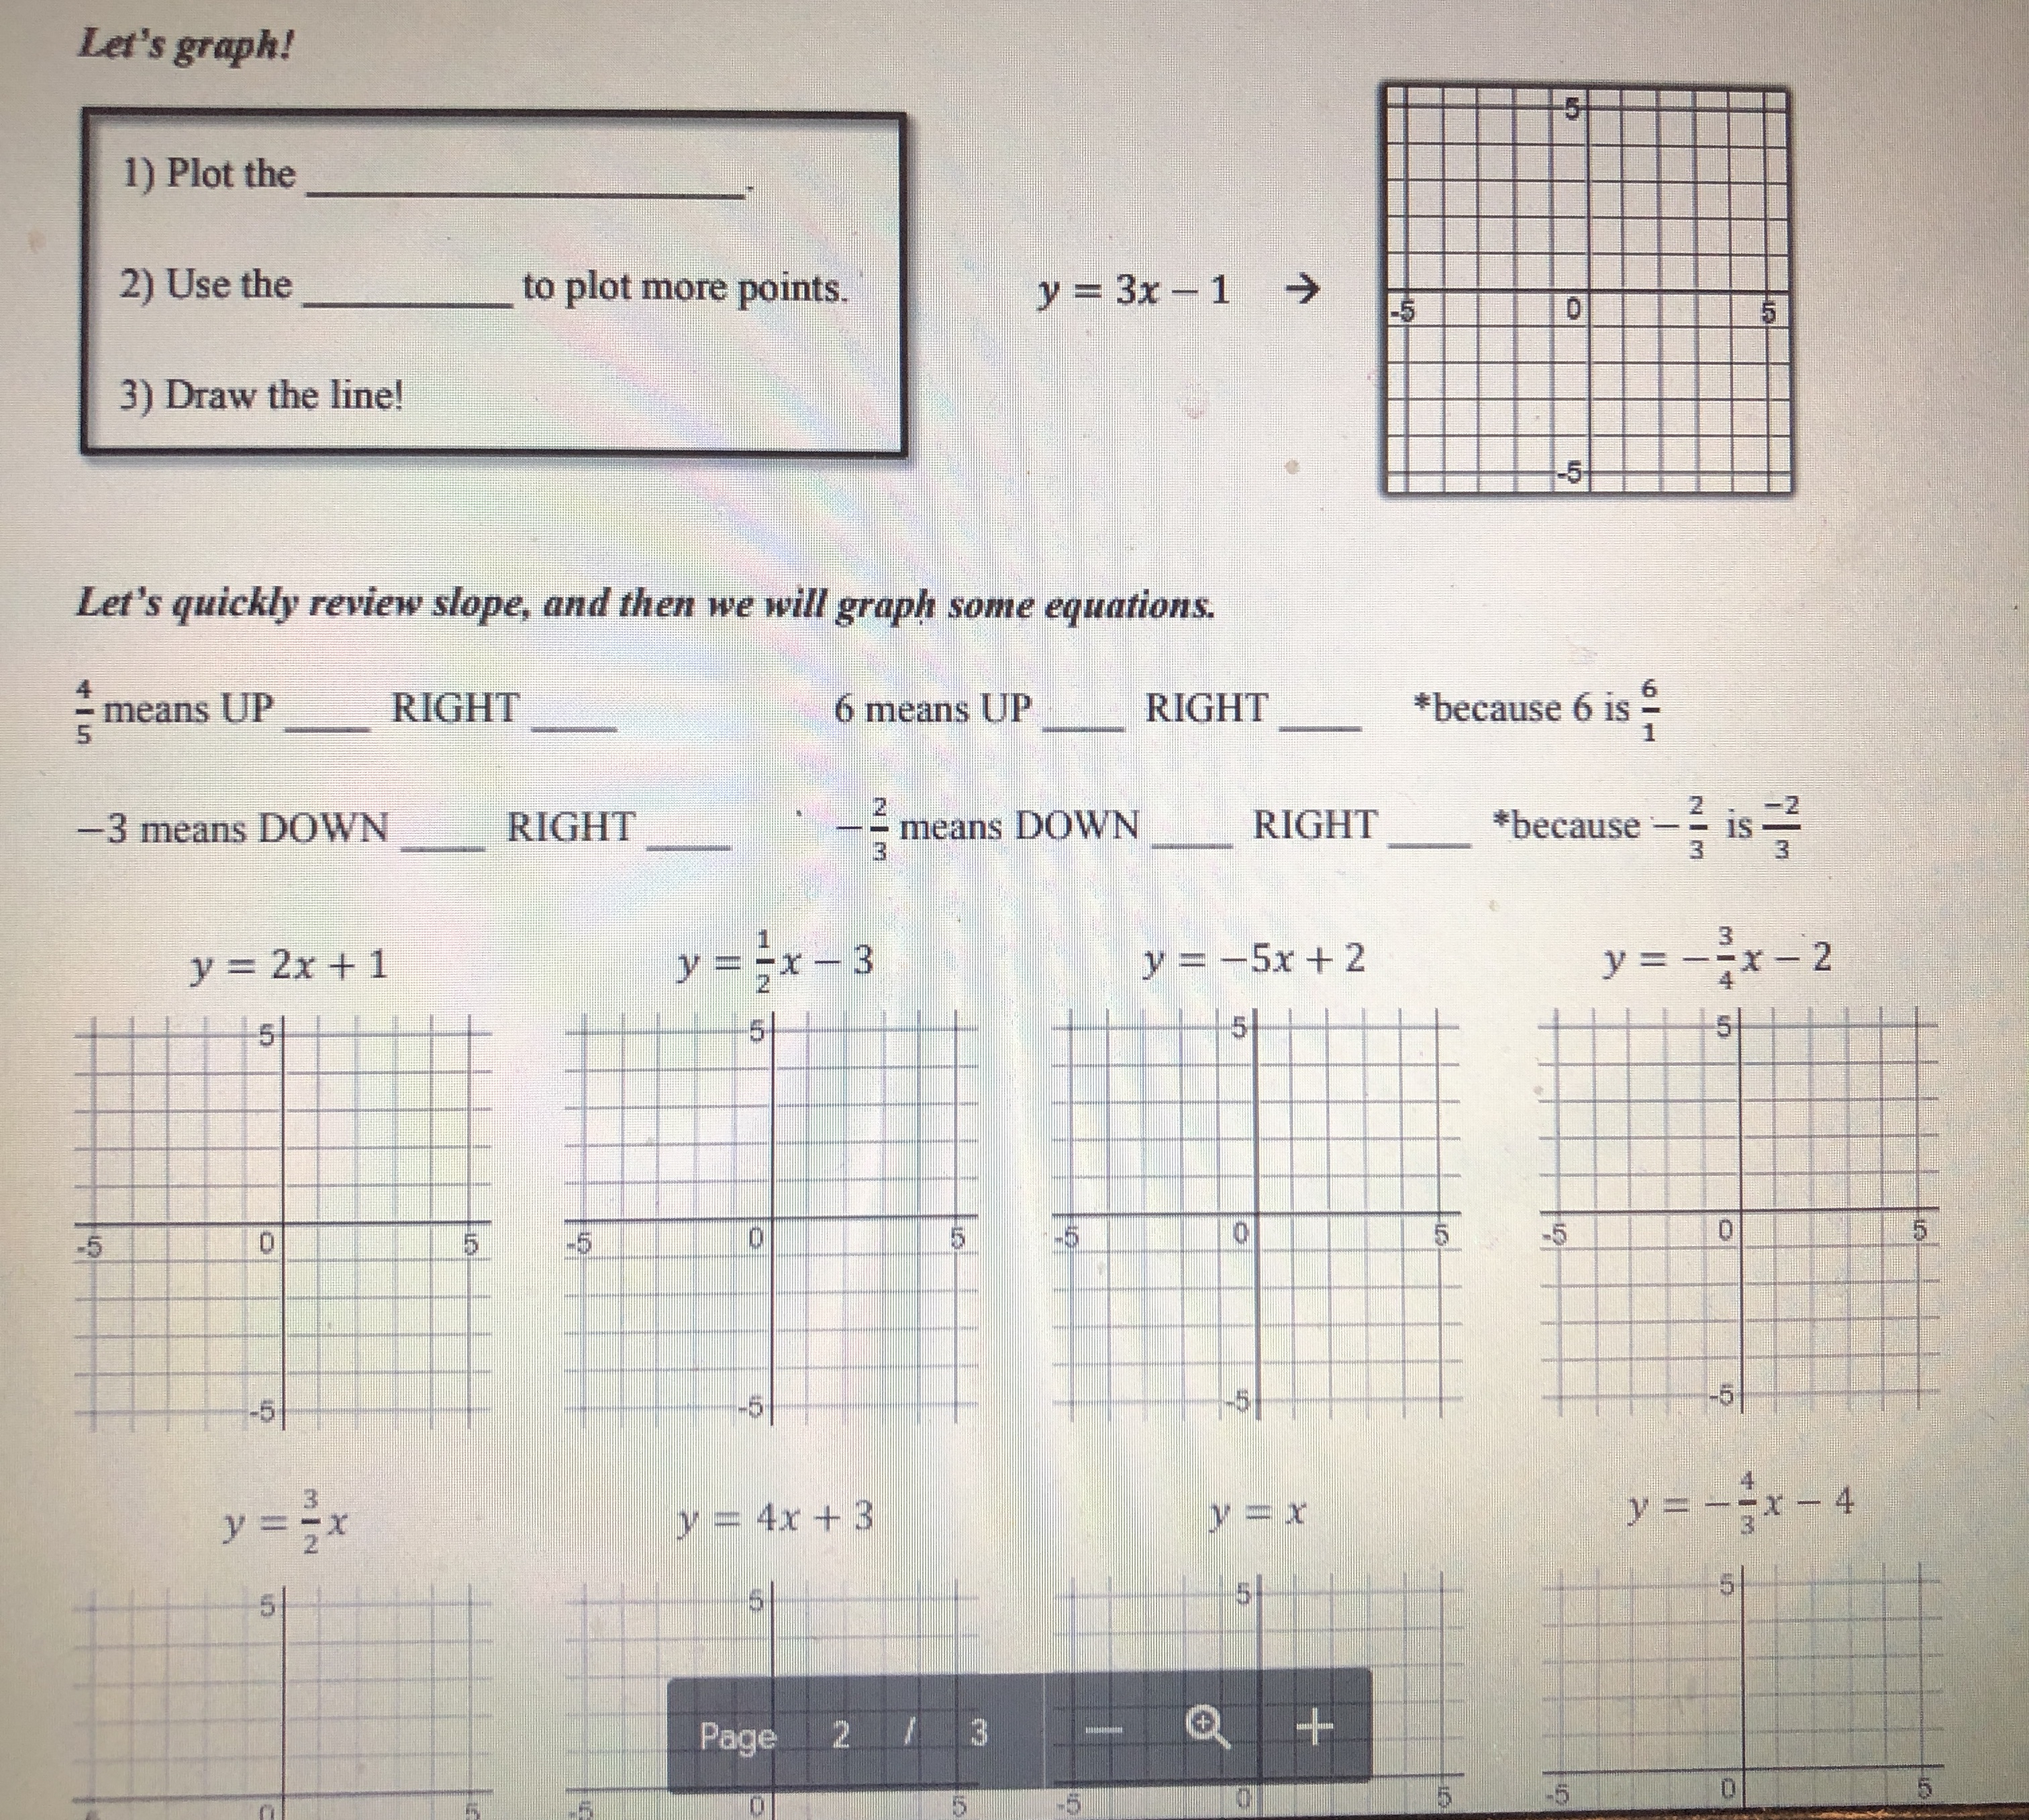
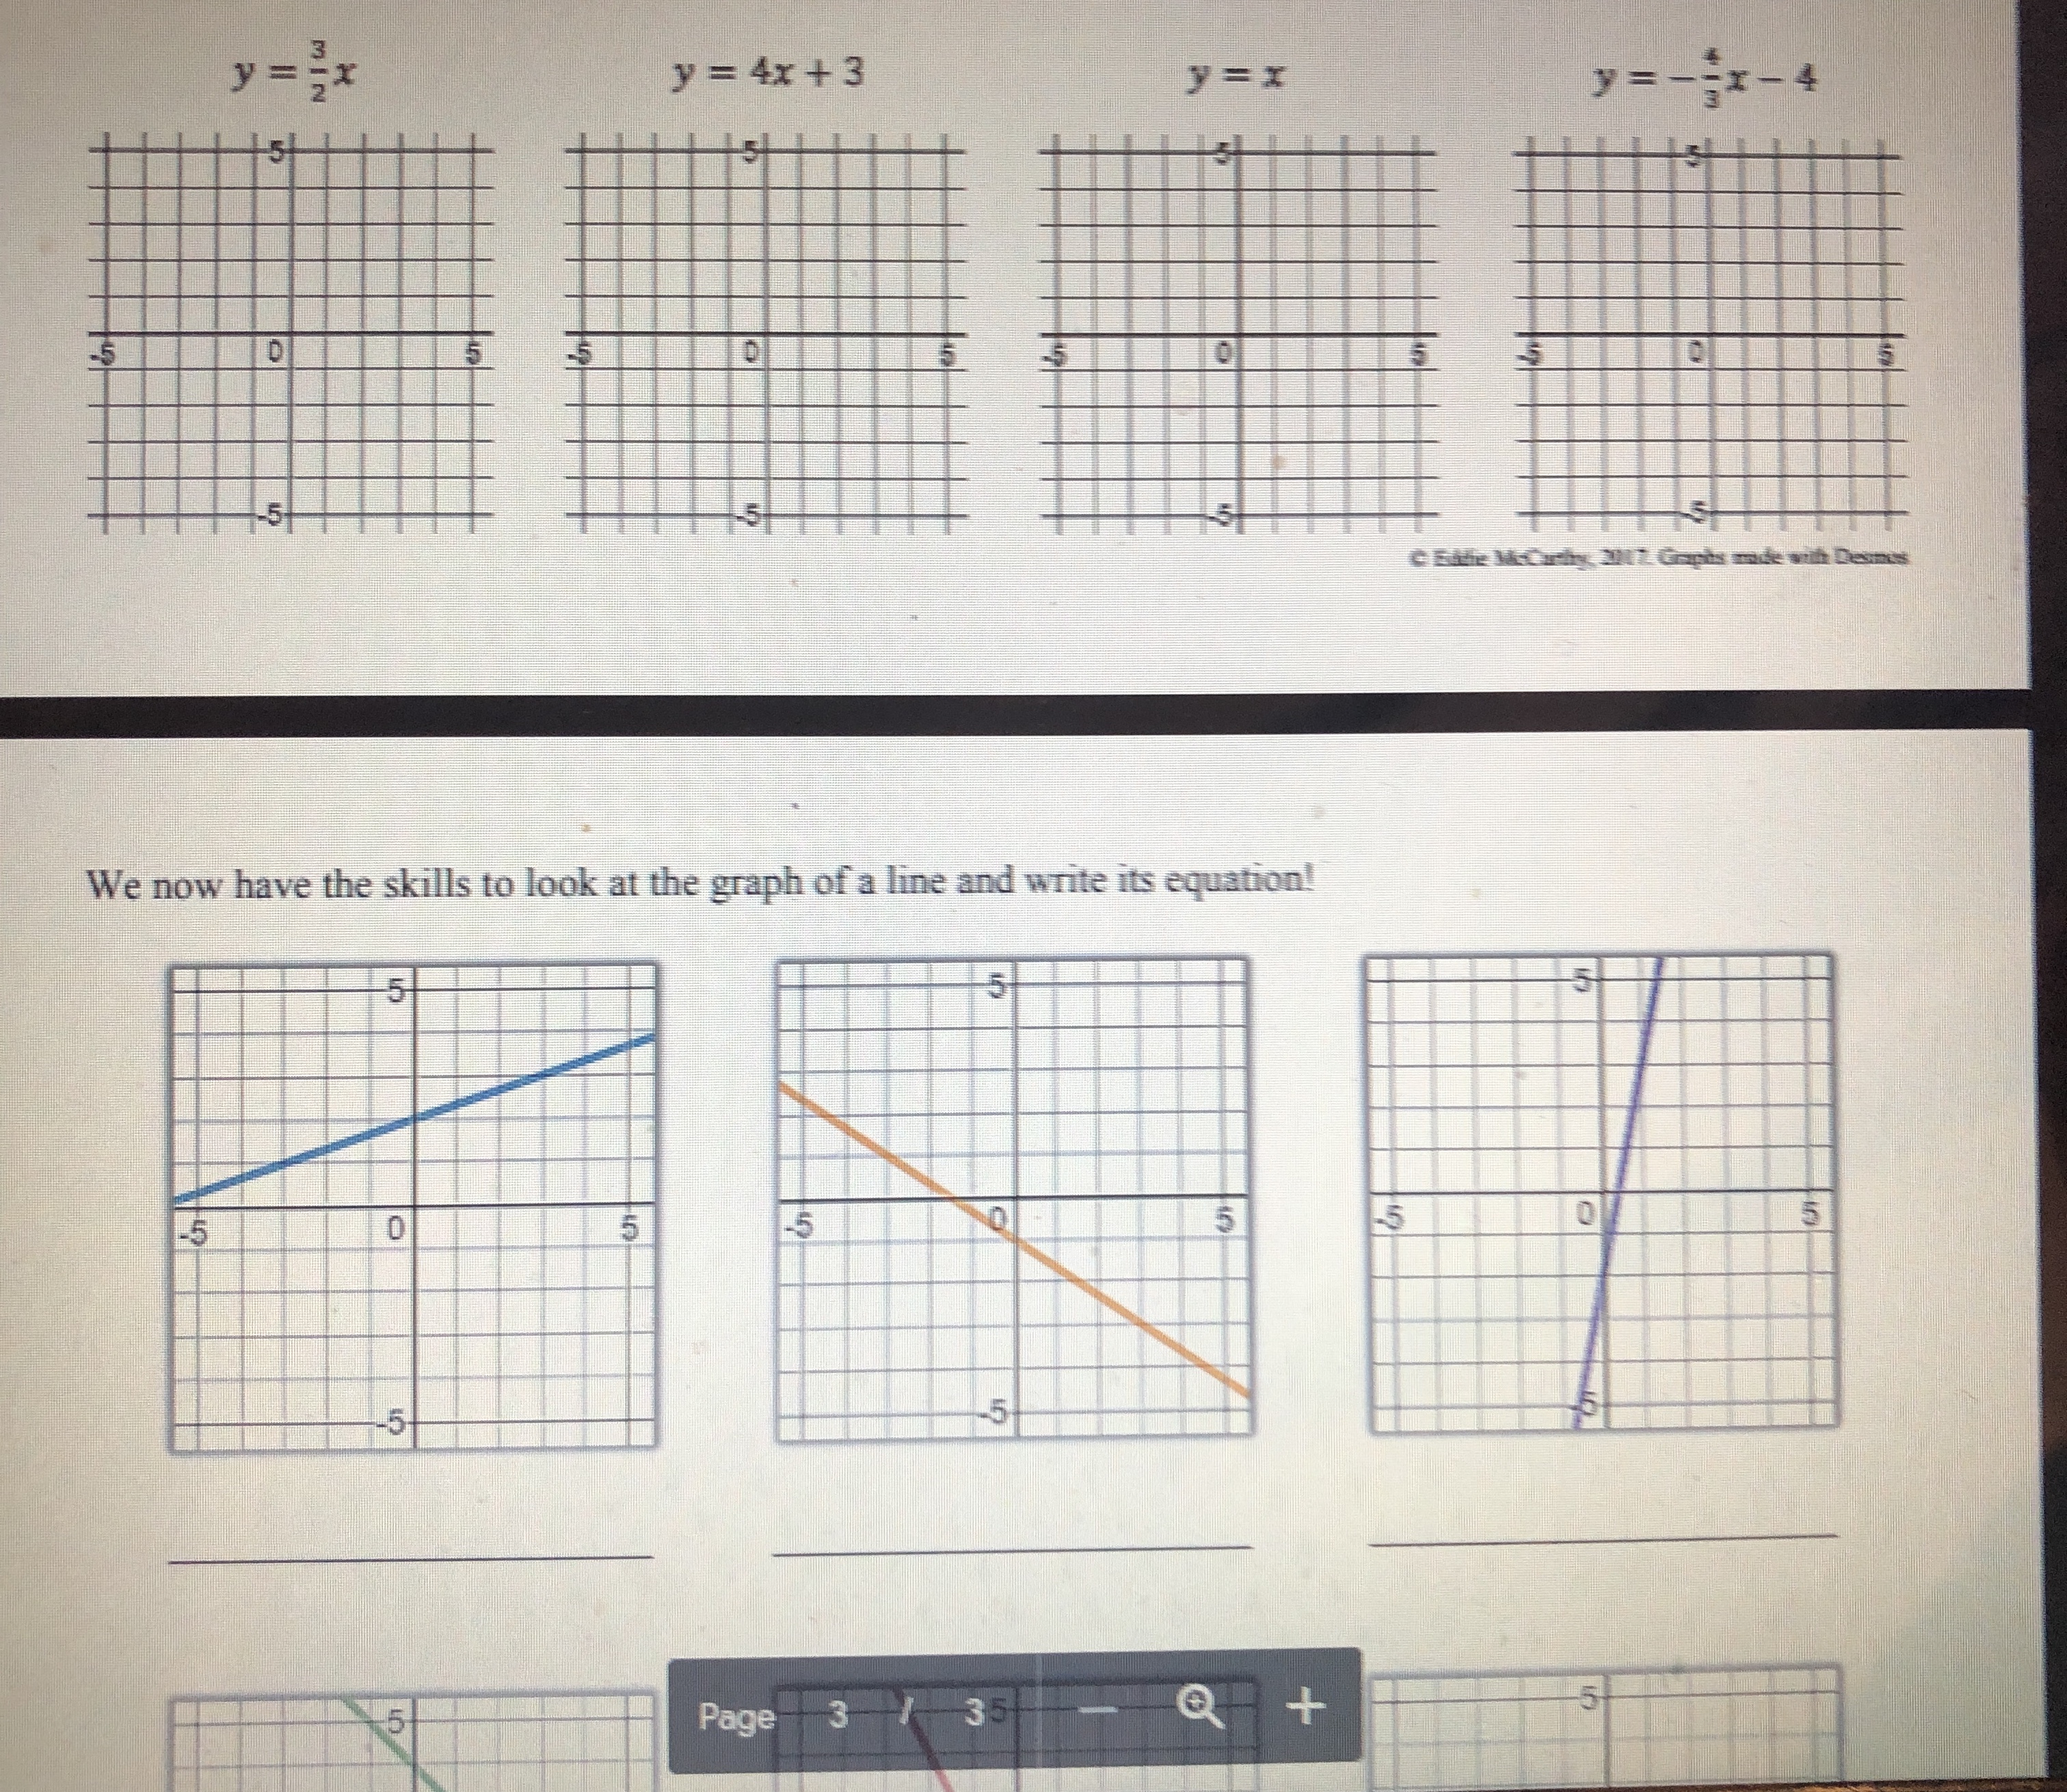
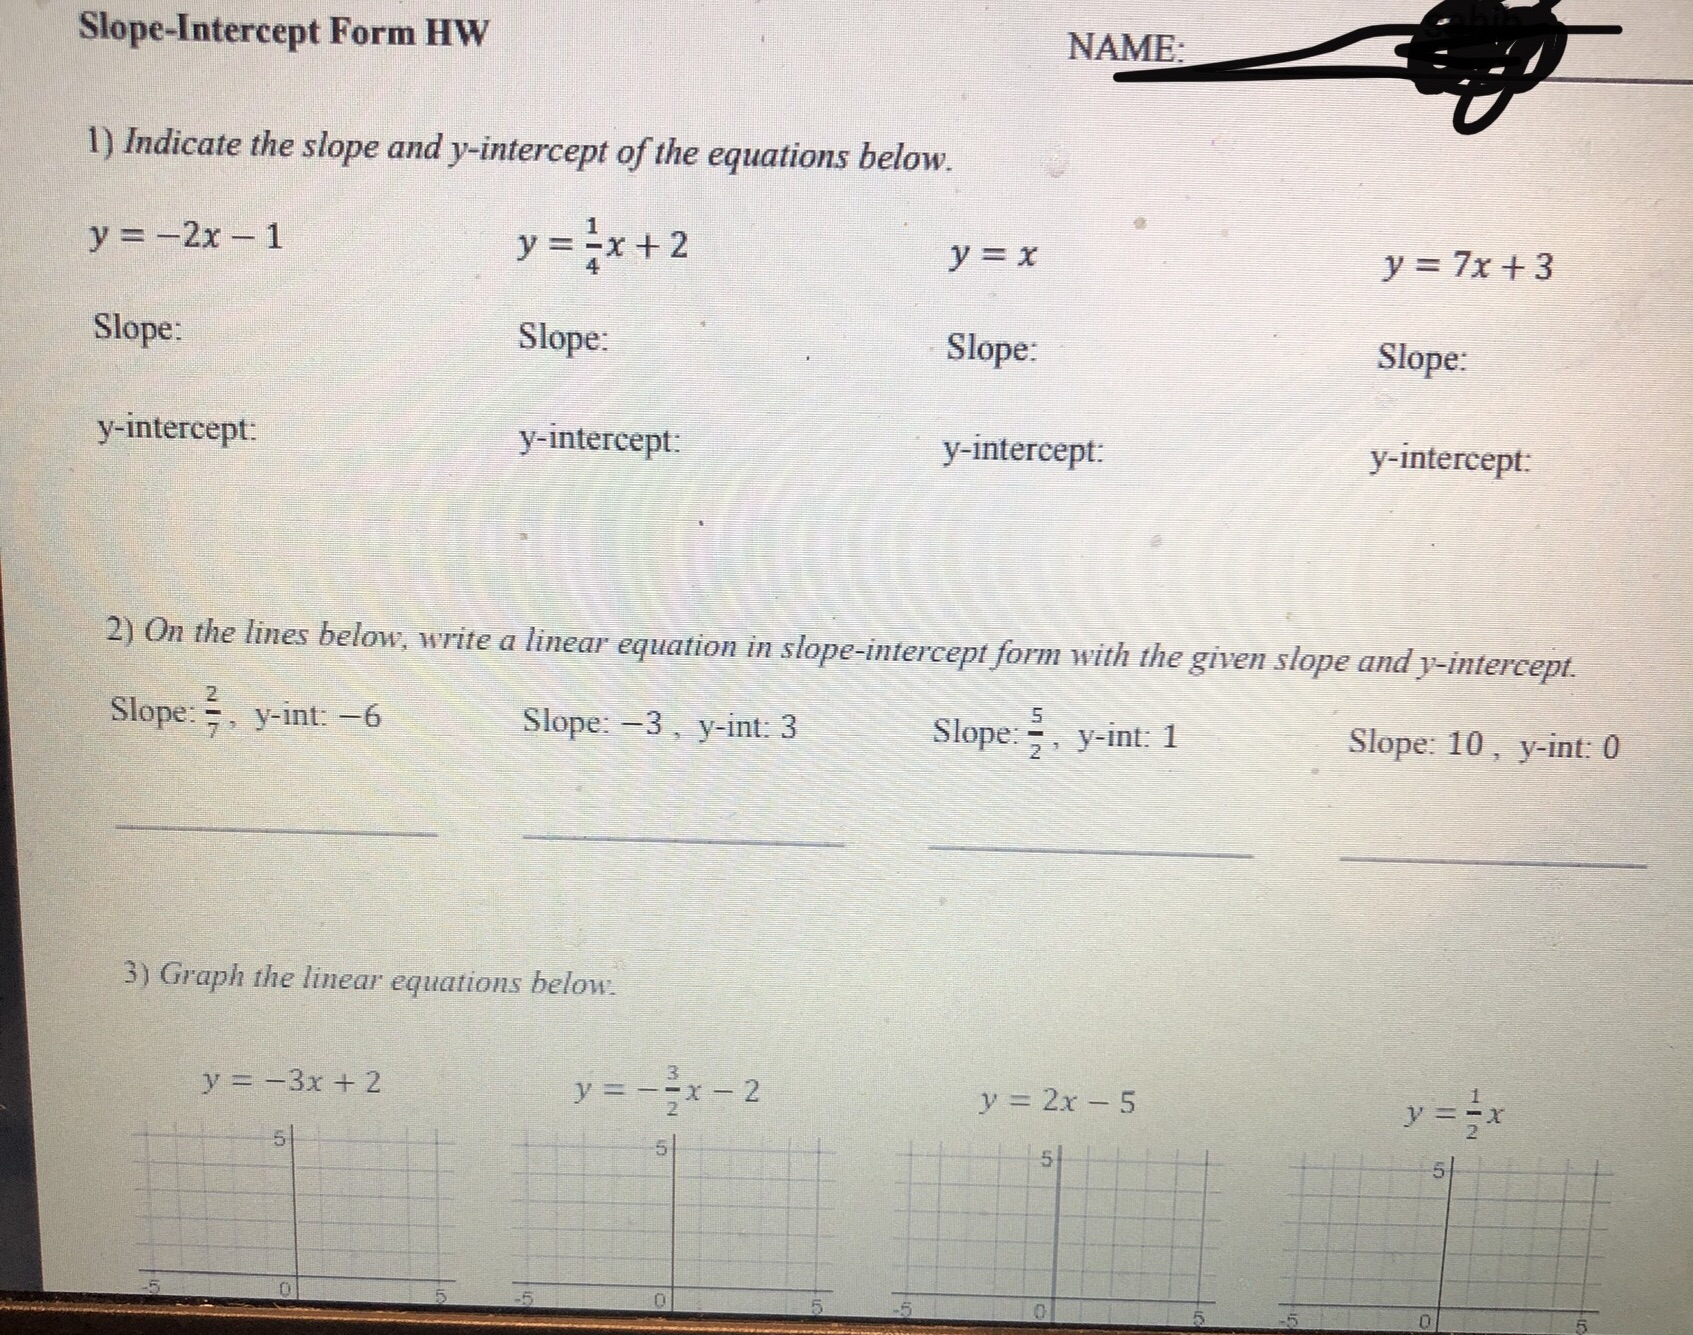
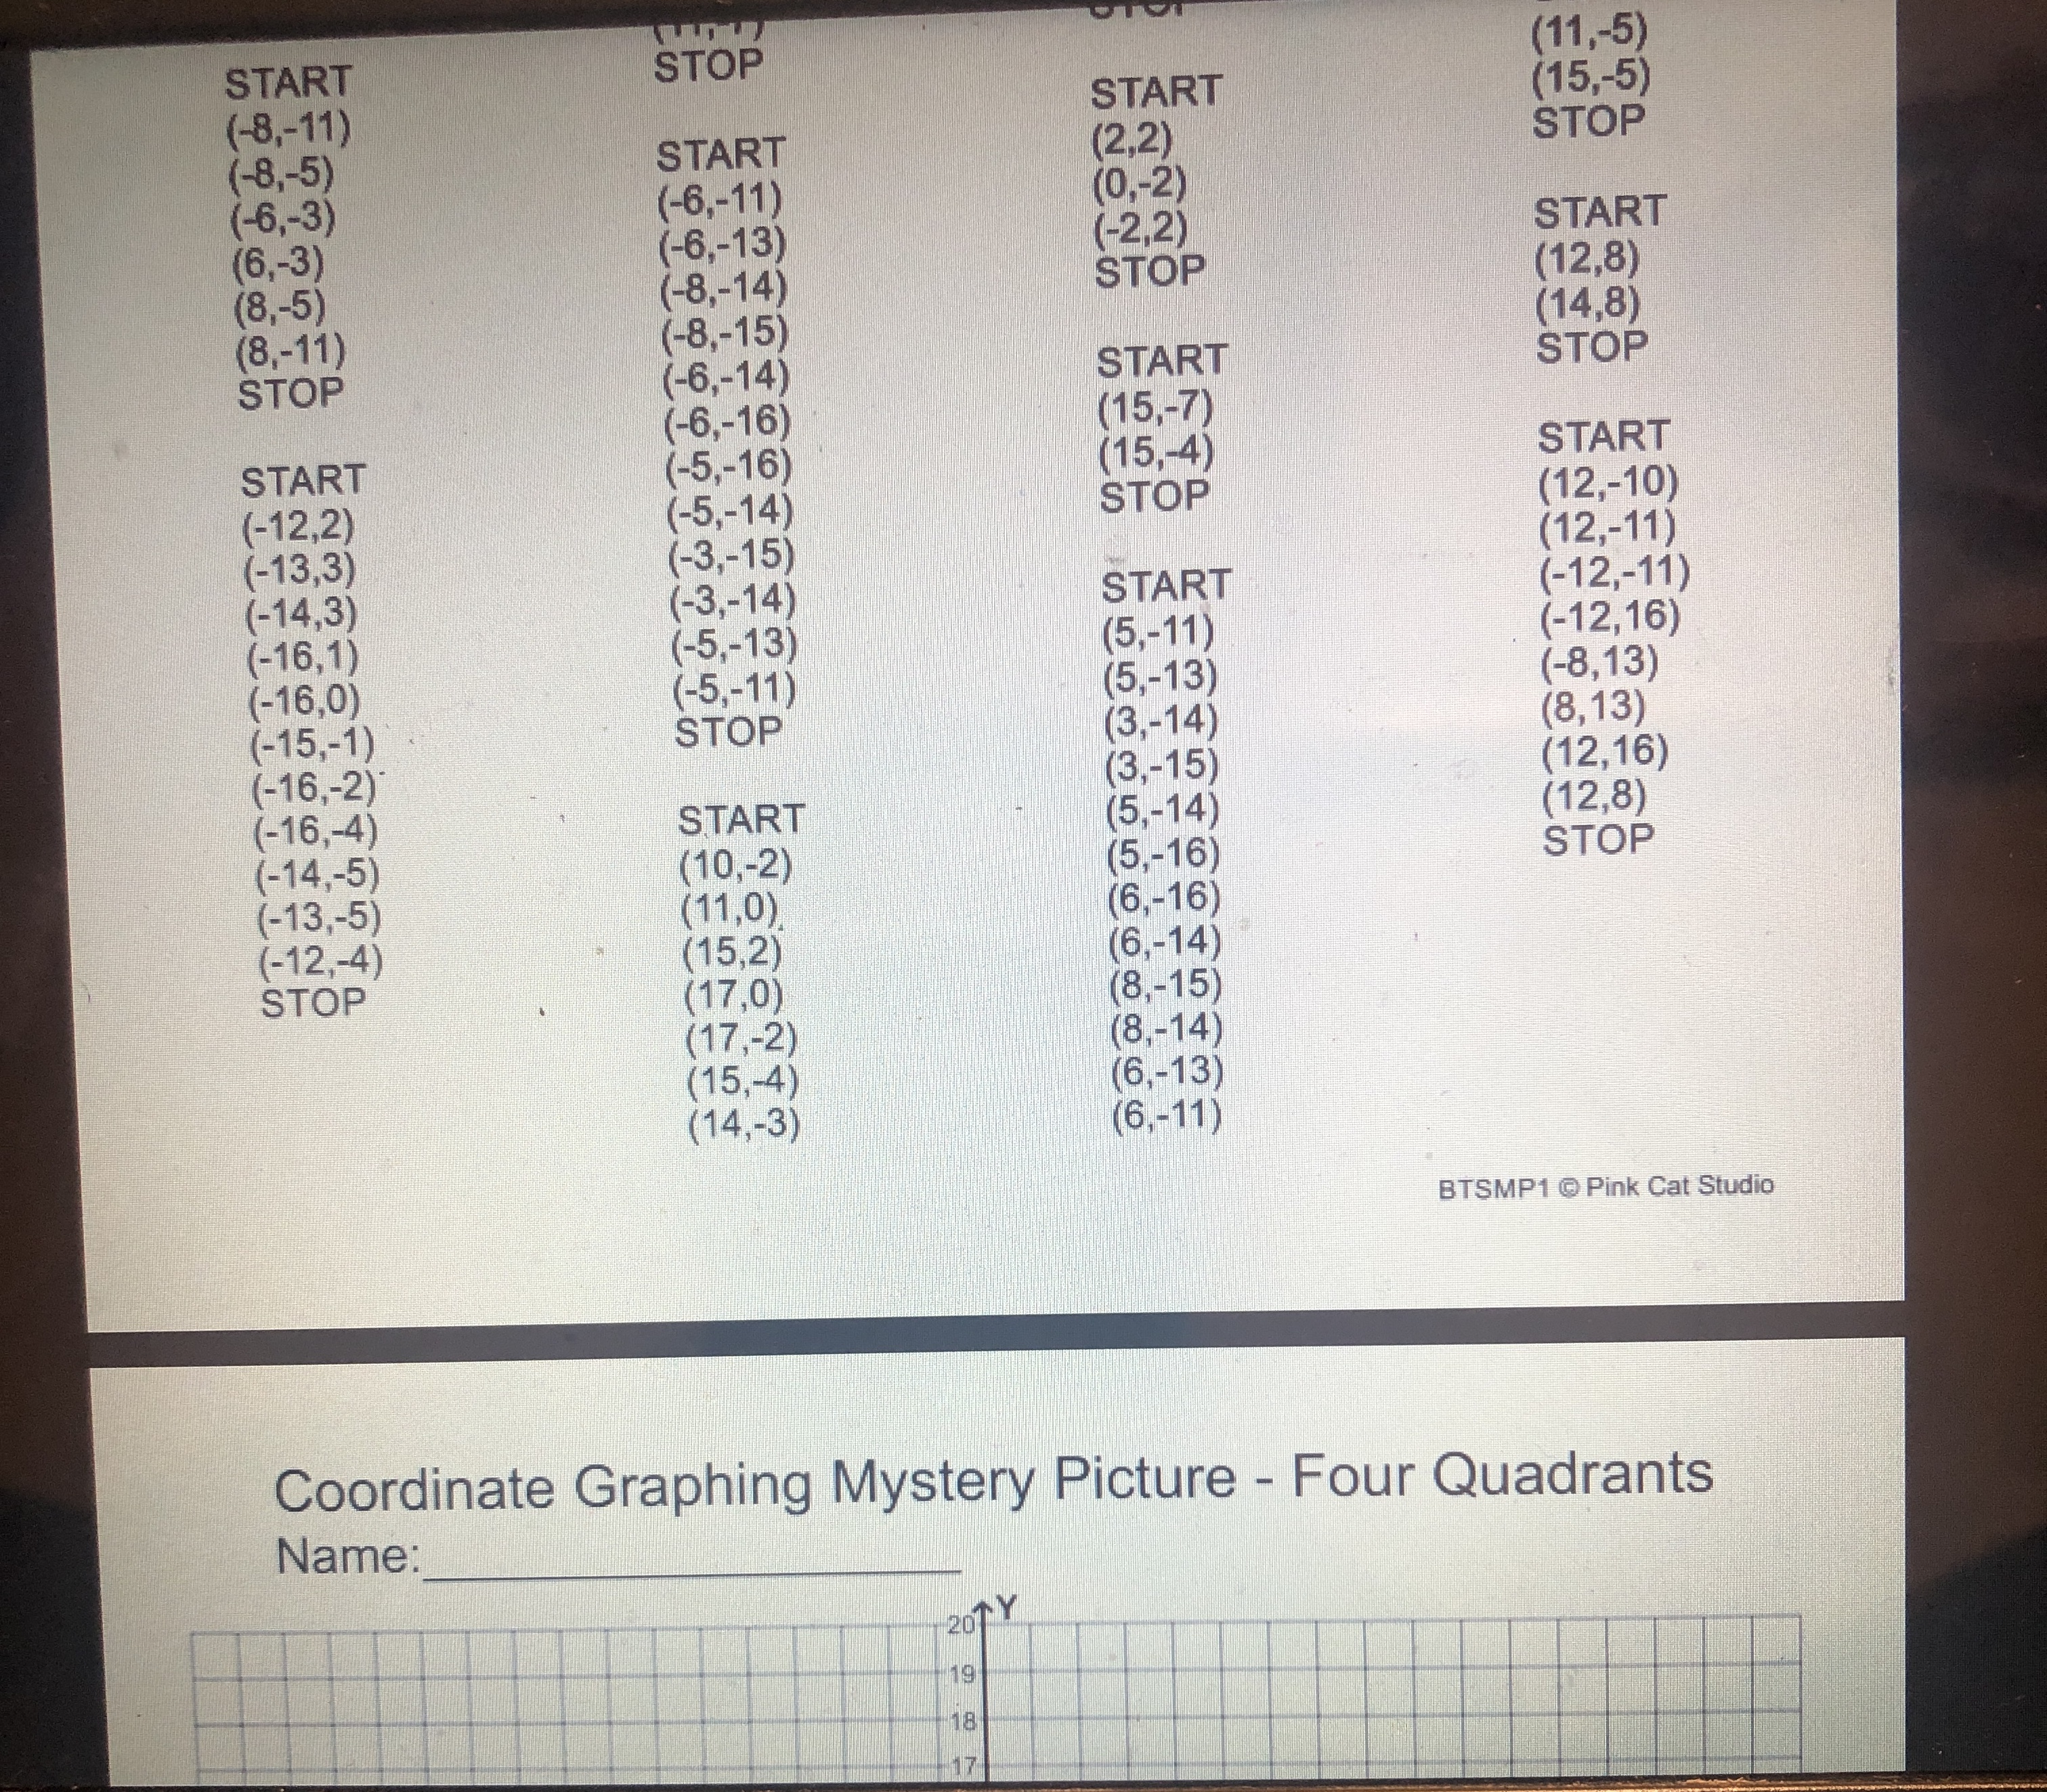
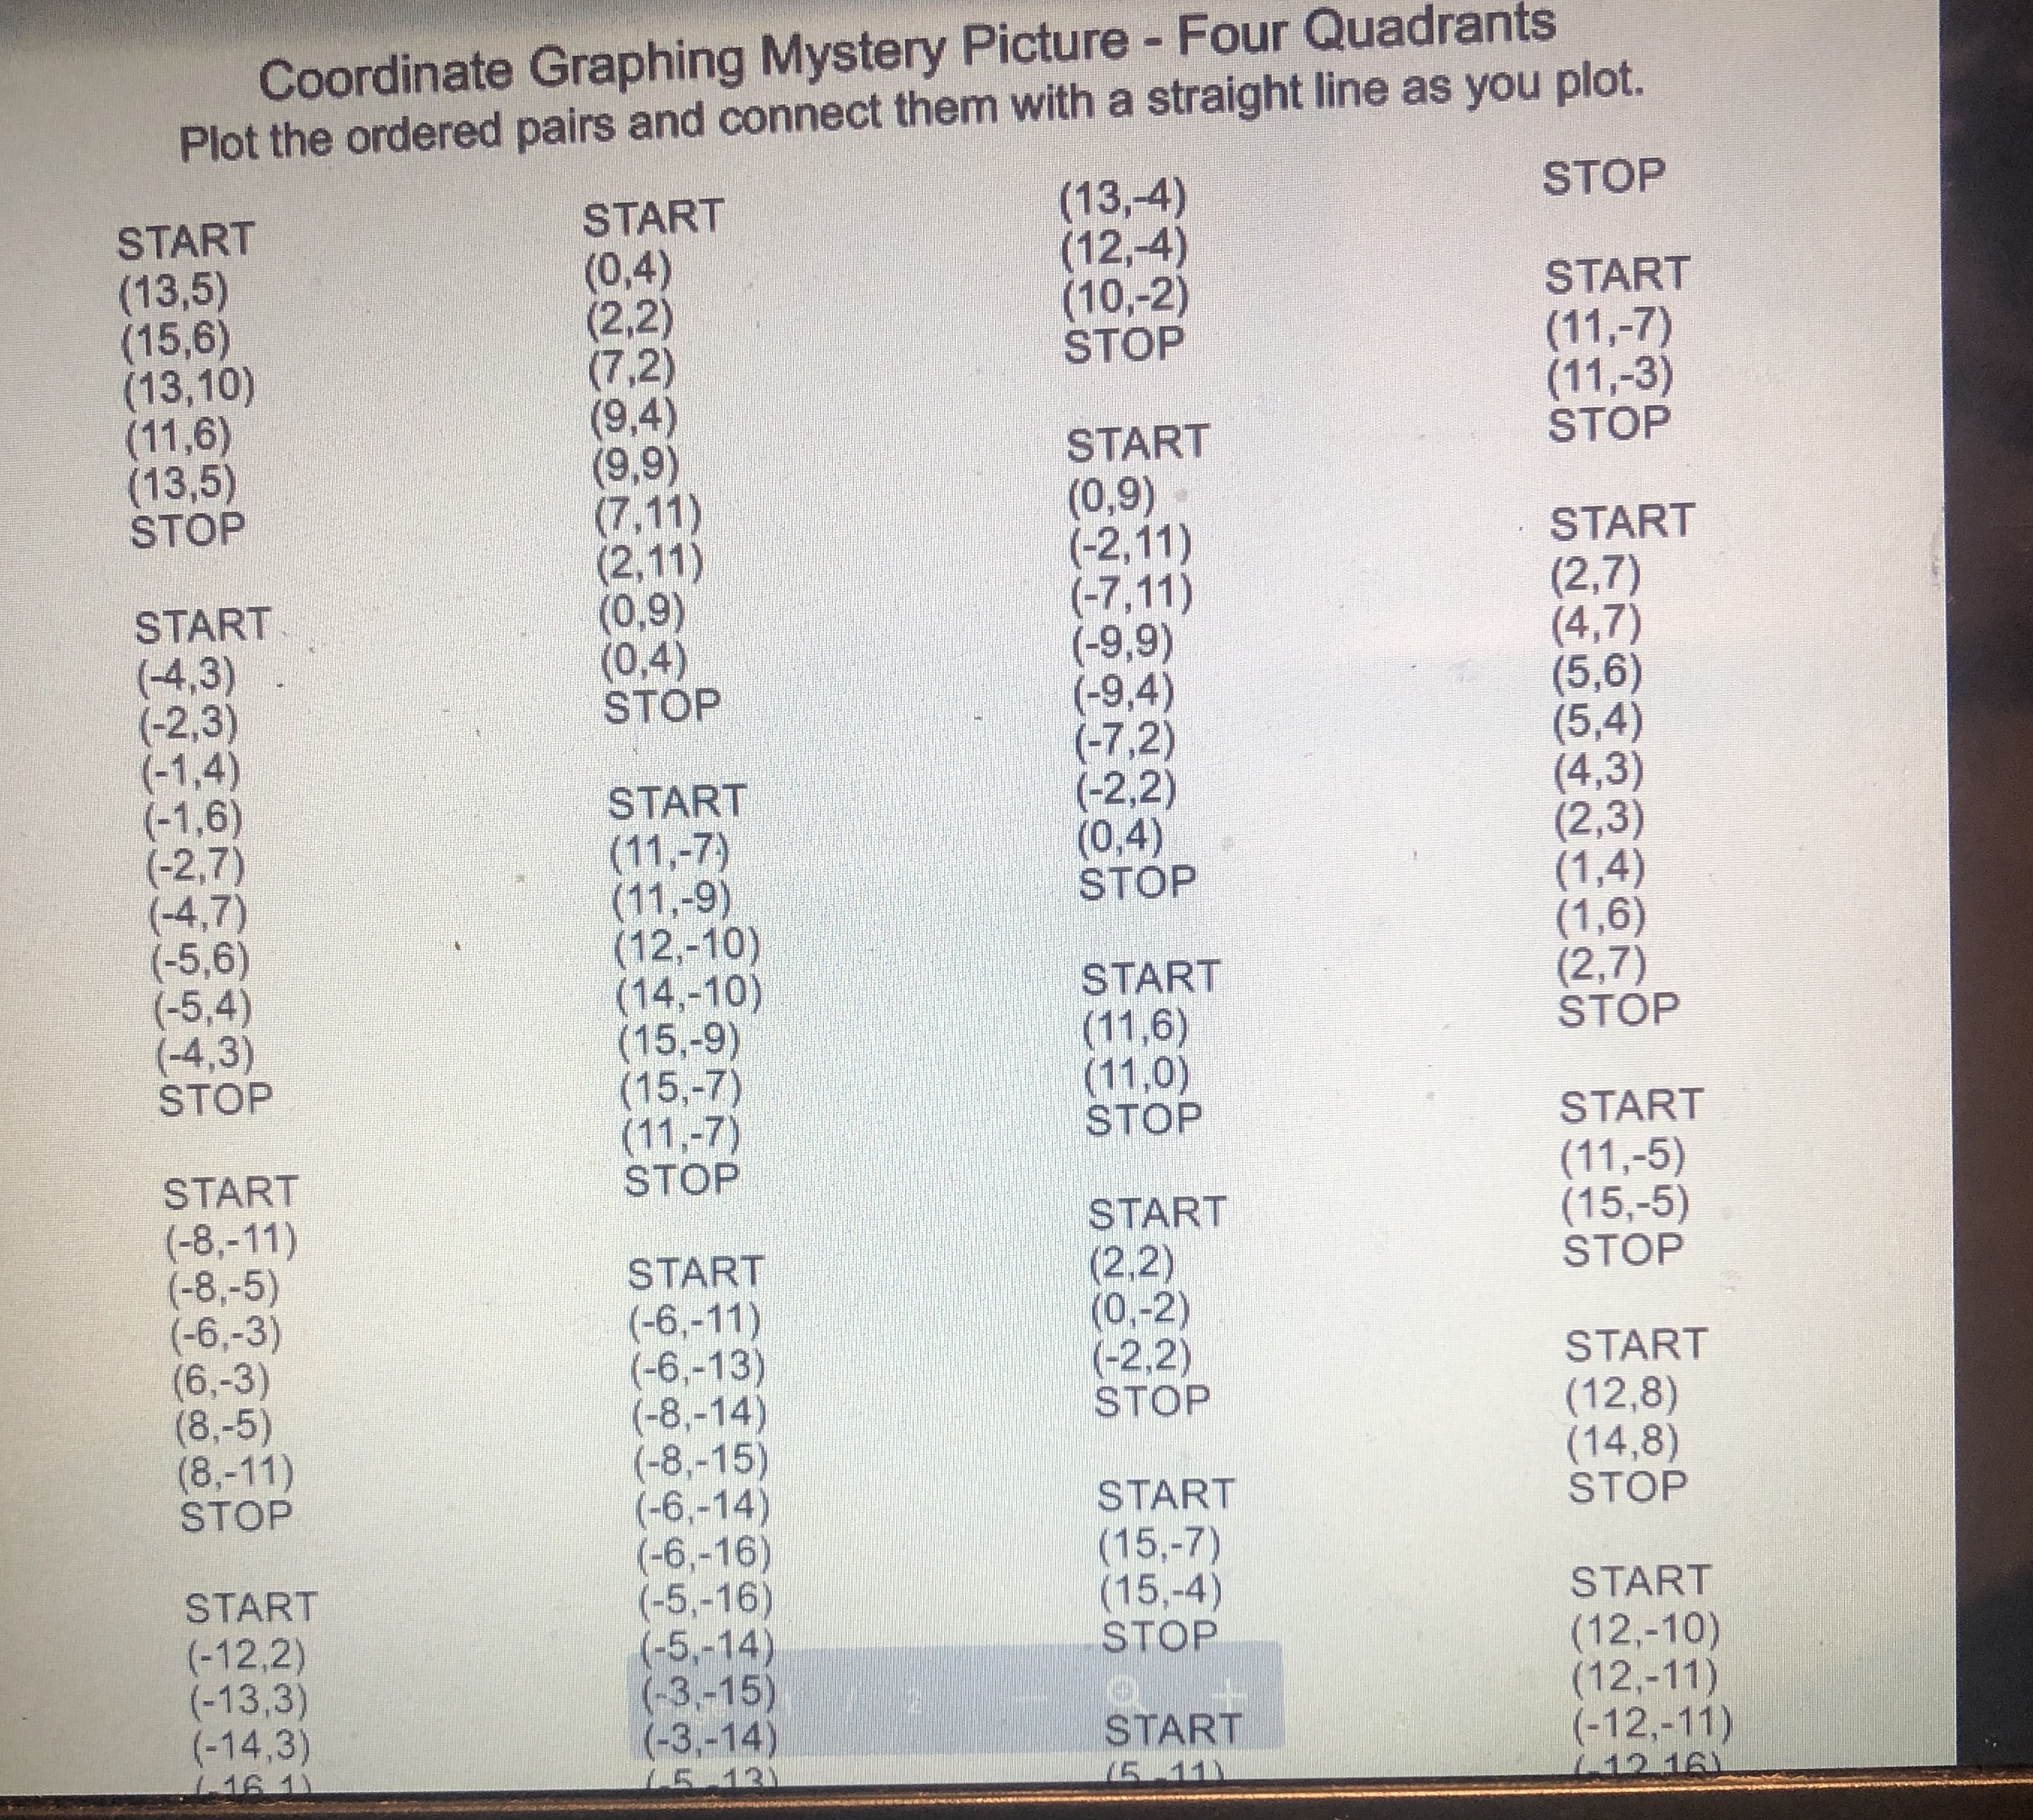
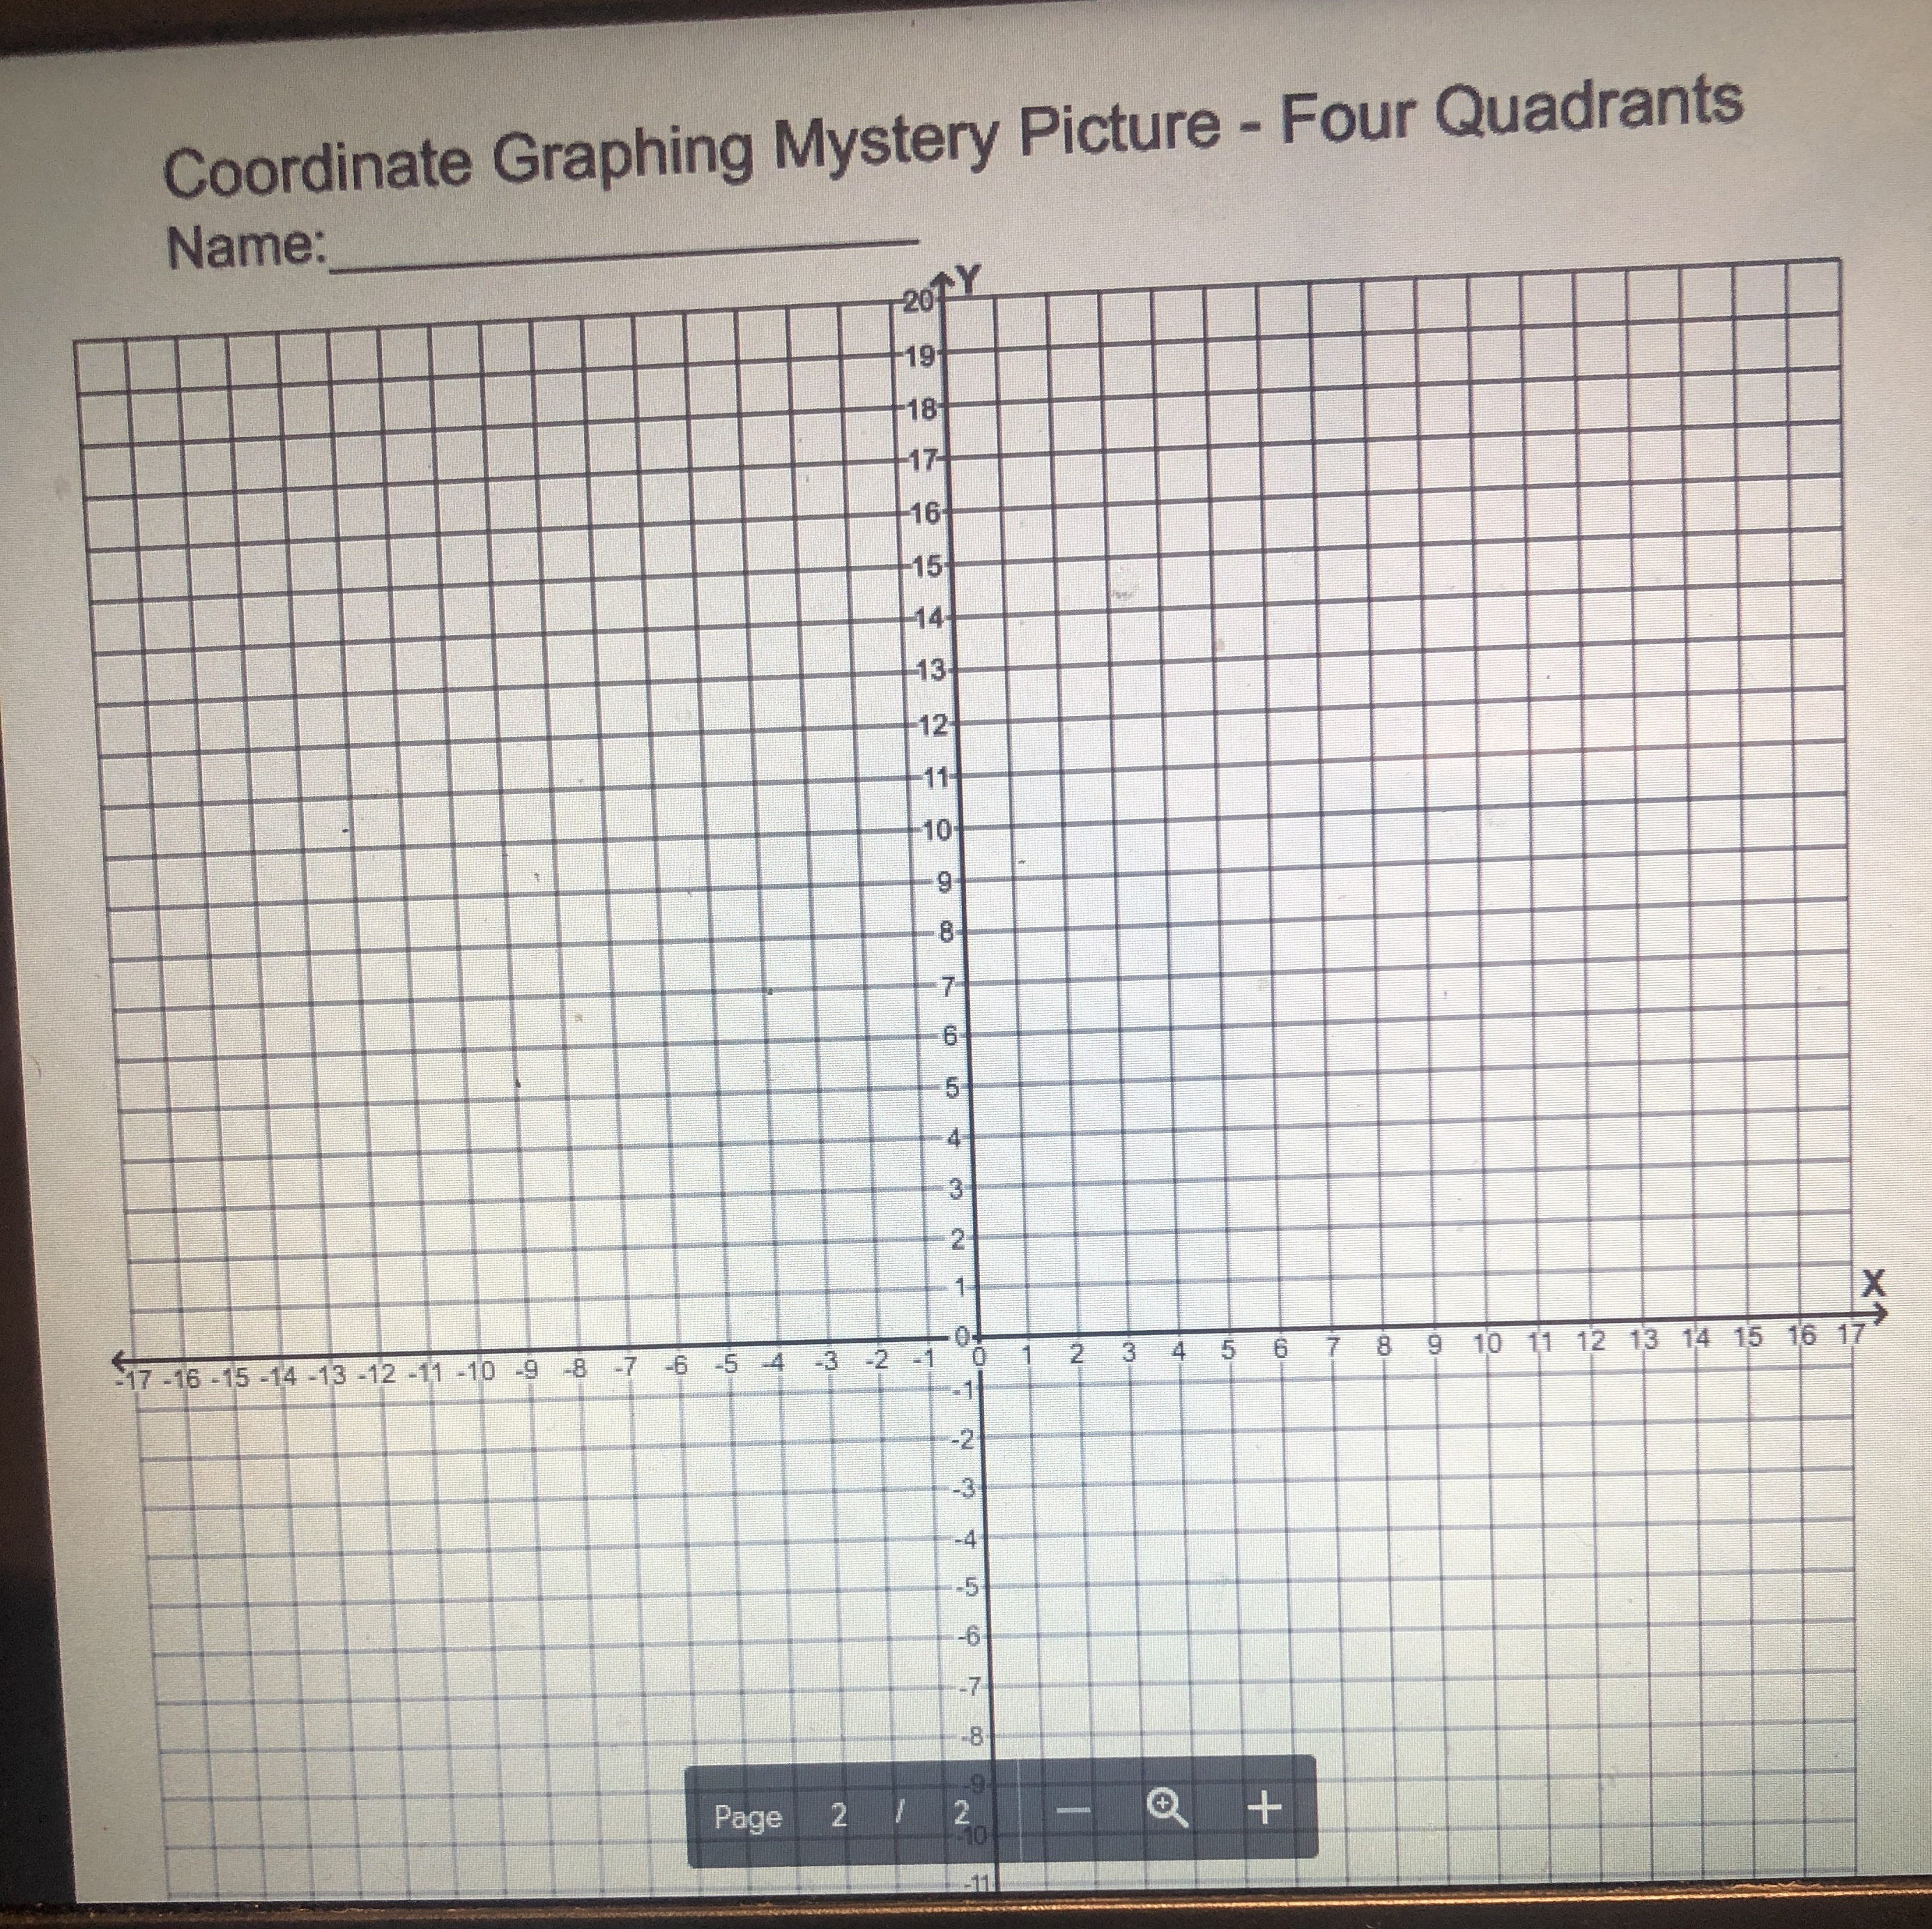
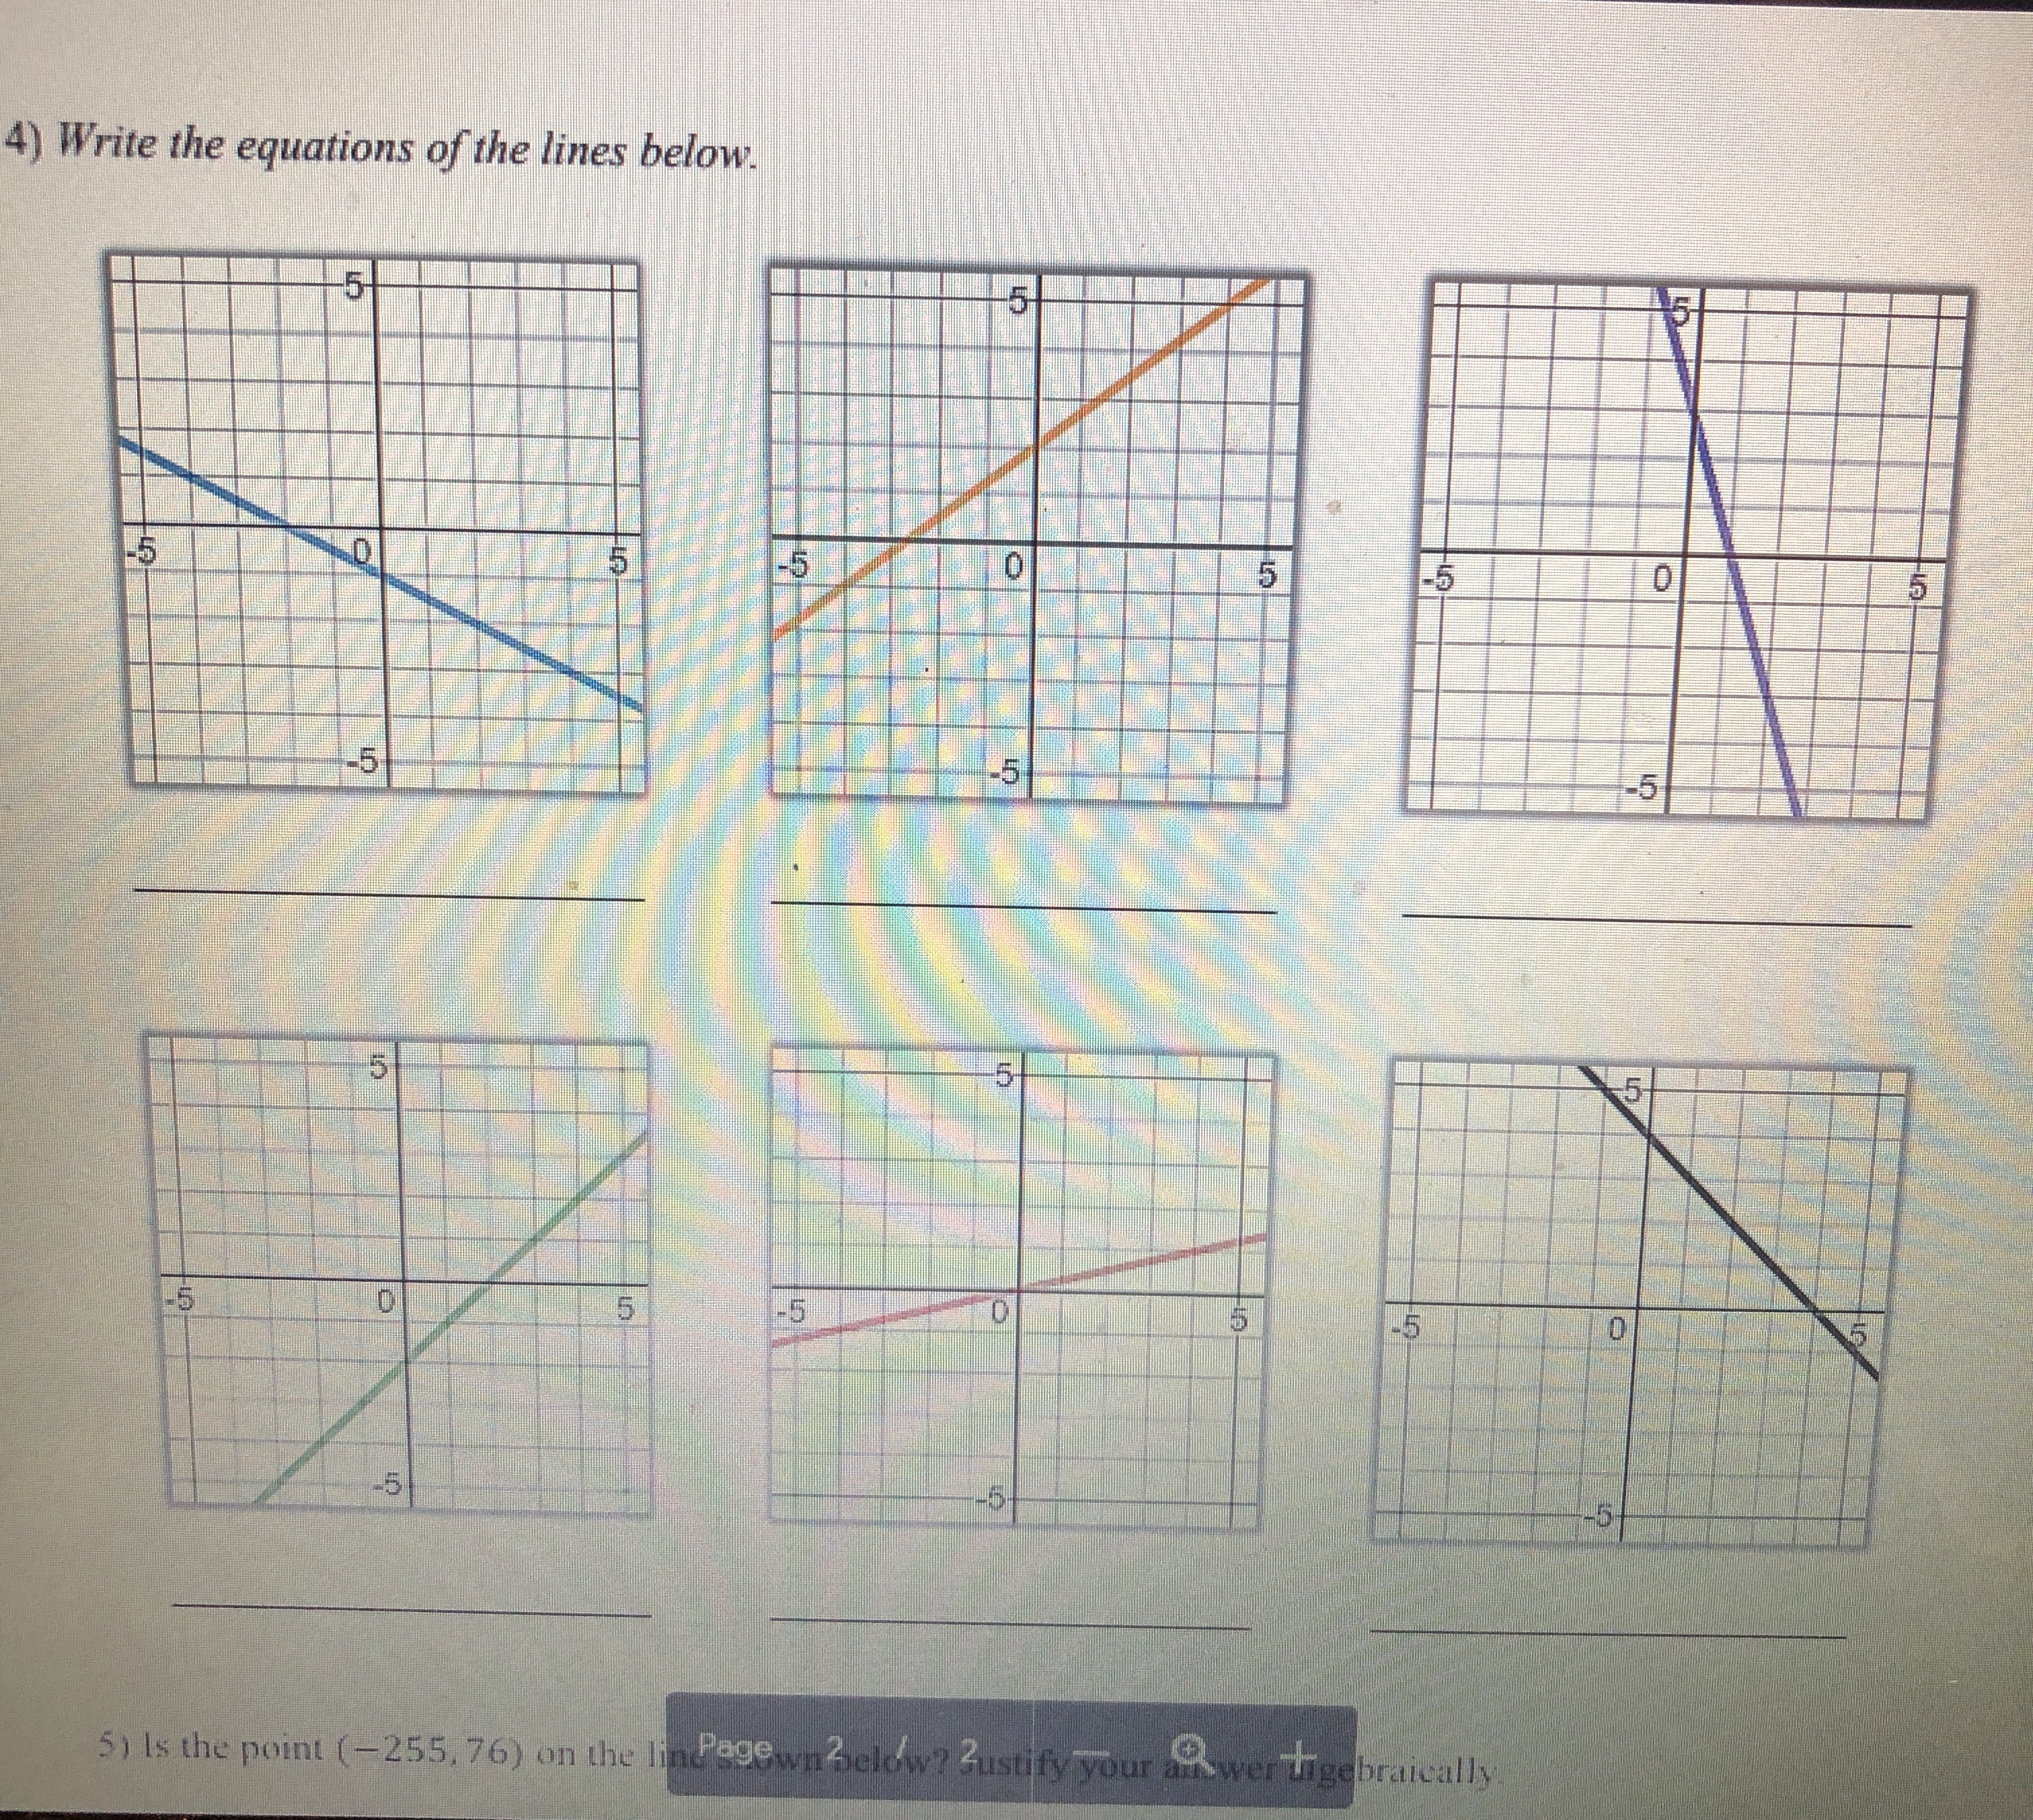
0 5 -5 -5 10 dn 5) Is the point (-255, 76) on the line shown below? Justify your answer algebraically. -5Graphing linear equations with tables takes way too long! What we notice about the equation y = -2x + 3 is that its slope is _and it crosses the y-axis at So, we now have a much faster way to graph linear equations! Slope-Intercept Form: SHORTCUT m (where it crosses the y-axis) C Eddie Mccarthy, 2017. Graphs made with Desmos Before we start graphing, let's practice recognizing the slope and y-intercept. y = 3x +4 -=x -5 y =x+6 y = -x Slope: Slope Slope: Slope: y-intercept: y-intercept: y-intercept: y-intercept: Let's graph! 1) Plot theGraph the linear equations below. y = -3x + 2 1 wa y = - -x - 2 y = 2x - 5 y = = x -5 5 -5 y = -=x+4 y = -5x - 3 y = -x y = =x+5 5 5 5 -5 5 -5 -5 Badche Mccarthy, 2017 Graphs made with Desmos 4) Write the equations of the lines below\f\fSlope-Intercept Form! Consider the graph to the right. Which of the following points below are on this line? (2,0)? (-3, -3)? -5 5 (-1,0)? (5, 1.5)? (6, 2)? (8, 3)? Even though the points (6, 2) and (8, 3) aren't pictured, we can still be confident that they are on the line. V But here is the real goal for this lesson > Is the point (128, 63) on the line above? To answer this, we need to get more comfortable with linear equations. Let's start by graphing one with a table. Graph the linear equation y = -2x + 3 by making a table. (x, y) (-1, (0, ) (1, ) N (2, )Let's graph! 1) Plot the 2) Use the to plot more points. y = 3x - 1 3) Draw the line! Let's quickly review slope, and then we will graph some equations. = means UP RIGHT 6 means UP RIGHT *because 6 is - -3 means DOWN RIGHT means DOWN RIGHT *because WIN is = y = 2x +1 y V = -5x + 2 y = -=x-2 5 -5 -5 O y = tw I w x =4x + 3 X y = 4 Page 2 13 + 5 -6y y = 4x +3 Y = I - 4 We now have the skills to look at the graph of a line and write its equation! -5 -5 -5 -5 -5 5 Page 3 35 +Slope-Intercept Form HW NAME: 1) Indicate the slope and y-intercept of the equations below. y = -2x - 1 y = =x+2 y = x y = 7x+3 Slope: Slope: Slope: Slope: y-intercept: y-intercept: y-intercept: y-intercept: 2) On the lines below, write a linear equation in slope-intercept form with the given slope and y-intercept. Slope: = , y-int: -6 Slope: -3 , y-int: 3 Slope: = , y-int: 1 Slope: 10, y-int: 0 3) Graph the linear equations below. y = -3x + 2 y = - -x-2 y = 2x - 5 y 5 5 55START STOP (11,-5) (-8,-11) START (15,-5) (-8,-5) START (2,2) STOP (-6,-3) (-6,-11) (0,-2) (6,-3) (-6,-13) (-2,2) START (8,-5) (-8,-14) STOP (12,8) (8,-11) (-8.-15) (14,8) STOP (-6,-14) START STOP (-6,-16) (15,-7) START (-5,-16) (15,-4) START (-12,2) (-5,-14) STOP (12,-10) (-13,3) (-3,-15) (12,-11) (-14,3) (-3,-14 START (-16,1) (-12,-11) (-5,-13 (5,-11) (-12, 16) (-16,0) (-5,-11) (5,-13) (-8,13) (-15,-1) STOP (3,-14) (-16,-2) (8,13) (3,-15) (-16,-4) (12, 16) START (5,-14) (-14,-5) (12,8) (10,-2) (5,-16) (-13,-5) STOP (11,0) (6,-16) (-12,-4) (15,2) STOP (6,-14) (17,0) (8,-15) (17,-2) (8,-14) (15,-4) (6,-13) (14,-3) (6,-11) BTSMP1 @ Pink Cat Studio Coordinate Graphing Mystery Picture - Four Quadrants Name: 20 19Coordinate Graphing Mystery Picture - Four Quadrants Plot the ordered pairs and connect them with a straight line as you plot. START START (13,-4) STOP (13,5) (0,4) (12,-4) (15,6) (2,2) (10,-2) START (13, 10) (7,2) STOP (11,-7) (11,6) (9.4) (11,-3) (13,5) (9,9) START STOP STOP (7,11) (0,9) (2,11) (-2,11) START START (0,9) (-7, 11) (2,7) (-4,3) (0,4) ( -9,9) (4, 7) (-2,3) STOP (-9,4 ) (5,6) (-1,4) (-7,2) (5,4) (-1,6) START (-2,2) (4,3) (-2,7) (11,-7) (0,4) (2,3) (-4,7) (11,-9) STOP (1,4) (-5,6) (12,-10) (1,6) (-5,4) (14,-10) START (2,7) (-4,3) (15,-9) (11,6) STOP STOP (15,-7) (11,0) (11,-7) STOP START START STOP (11,-5) (-8,-11) START (15,-5) (-8,-5) START (2.2) STOP (-6,-3) (-6,-11) (0,-2) (6,-3) (-6,-13) (-2.2) START (8,-5) (-8,-14) STOP (12,8) (8,-11) (-8,-15) (14,8) STOP (-6,-14) START STOP (-6,-16) (15,-7) START (-5,-16) (15,-4) START (-12,2) (-5,-14) STOP (-13,3) (12,-10) (-3,-15) (-14,3) (-3,-14) (12,-11) 16 1 START 5 12 (-12,-11) 15 11 12 16\f\f
Step by Step Solution
There are 3 Steps involved in it

Get step-by-step solutions from verified subject matter experts