

Question: = 0 Bonus Problem (5 points) To understand just how much different subsets can differ, create a 5 fold partitioning of the cars data included
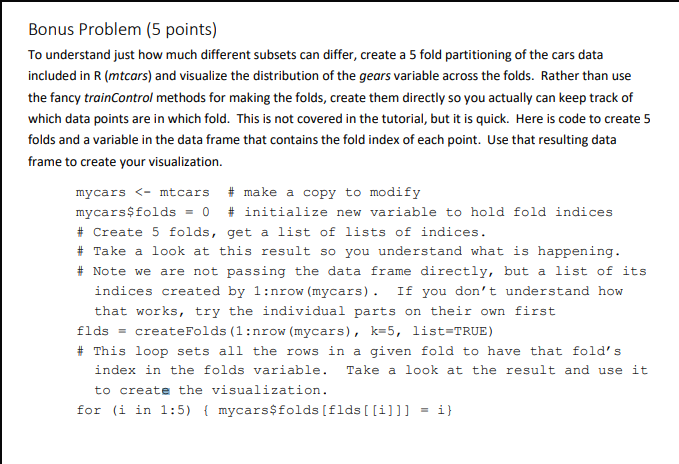
= 0 Bonus Problem (5 points) To understand just how much different subsets can differ, create a 5 fold partitioning of the cars data included in R(mtcars) and visualize the distribution of the gears variable across the folds. Rather than use the fancy trainControl methods for making the folds, create them directly so you actually can keep track of which data points are in which fold. This is not covered in the tutorial, but it is quick. Here is code to create 5 folds and a variable in the data frame that contains the fold index of each point. Use that resulting data frame to create your visualization. mycars
Step by Step Solution
There are 3 Steps involved in it
1 Expert Approved Answer
Step: 1 Unlock

Question Has Been Solved by an Expert!
Get step-by-step solutions from verified subject matter experts
Step: 2 Unlock
Step: 3 Unlock