

Question: 0 Demand Quantity In the accompanying diagram, the quantitative difference between areas A and C for reducing the price from P1 to P2 measures Multiple
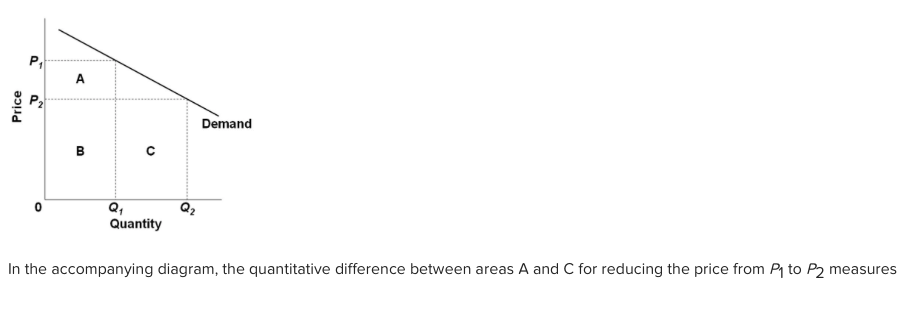
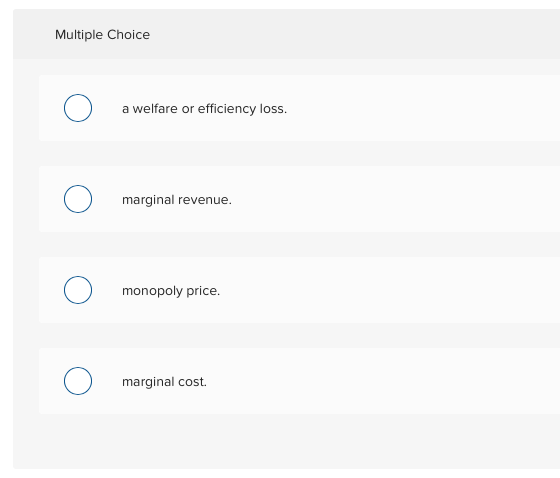
0 Demand Quantity In the accompanying diagram, the quantitative difference between areas A and C for reducing the price from P1 to P2 measures Multiple Choice a welfare or efficiency loss. marginal revenue. monopoly price marginal cost
Step by Step Solution
There are 3 Steps involved in it
1 Expert Approved Answer
Step: 1 Unlock

Question Has Been Solved by an Expert!
Get step-by-step solutions from verified subject matter experts
Step: 2 Unlock
Step: 3 Unlock