

Question: 0 Instructor's use only Do not alter Presentation 1 20.00 20.00 2 3 30.00 30.00 50.00 50.00 3 Answer 1 (I) Place your random
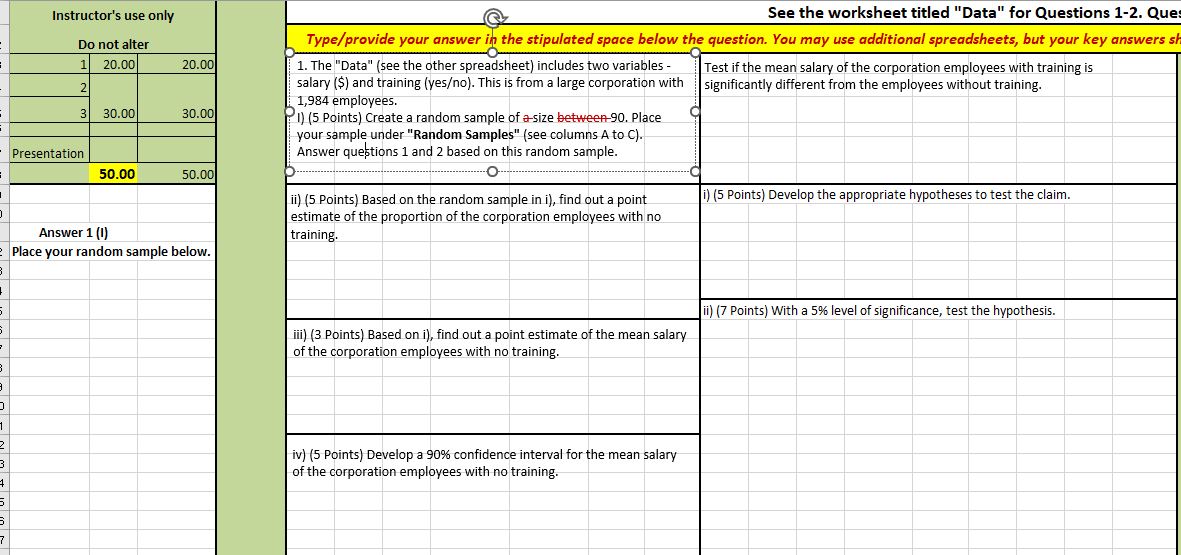
0 Instructor's use only Do not alter Presentation 1 20.00 20.00 2 3 30.00 30.00 50.00 50.00 3 Answer 1 (I) Place your random sample below. 5 5. 2 3. 0 1 2 3. 4. 5 7 See the worksheet titled "Data" for Questions 1-2. Ques Type/provide your answer in the stipulated space below the question. You may use additional spreadsheets, but your key answers sh 1. The "Data" (see the other spreadsheet) includes two variables - salary ($) and training (yes/no). This is from a large corporation with 1,984 employees. 1) (5 Points) Create a random sample of a-size between 90. Place your sample under "Random Samples" (see columns A to C). Answer questions 1 and 2 based on this random sample. ii) (5 Points) Based on the random sample in i), find out a point estimate of the proportion of the corporation employees with no training. Test if the mean salary of the corporation employees with training is significantly different from the employees without training. i) (5 Points) Develop the appropriate hypotheses to test the claim. iii) (3 Points) Based on i), find out a point estimate of the mean salary of the corporation employees with no training. ii) (7 Points) With a 5% level of significance, test the hypothesis. iv) (5 Points) Develop a 90% confidence interval for the mean salary of the corporation employees with no training.
Step by Step Solution
There are 3 Steps involved in it

Get step-by-step solutions from verified subject matter experts