

Question: 0 Question 1 E4 015 pts '0 3 3 99 G) Details You are conducting a study to see if the proportion of voters who
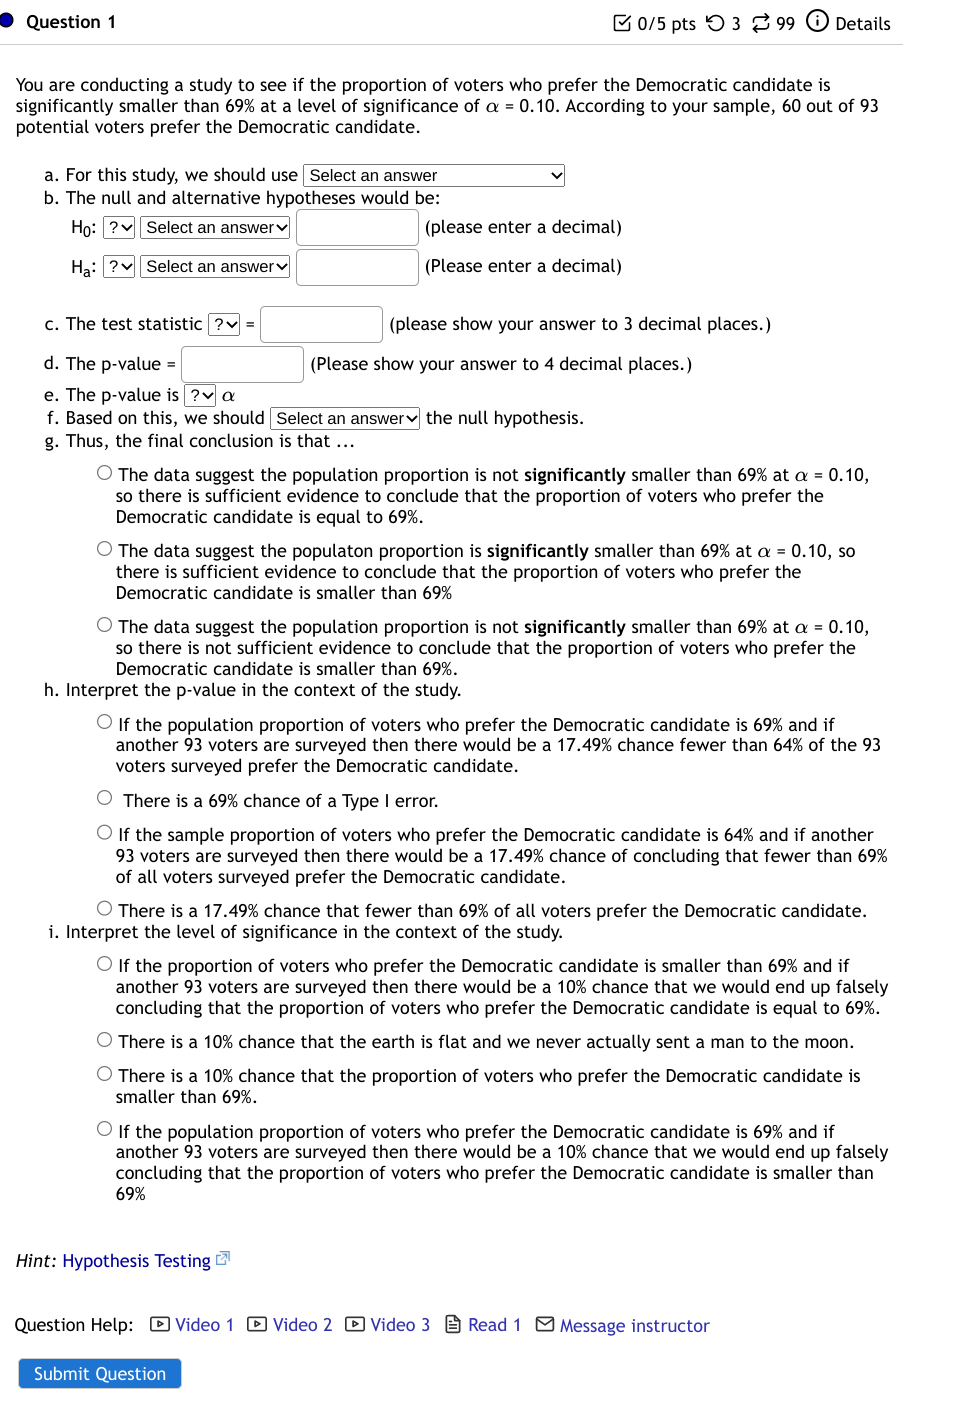
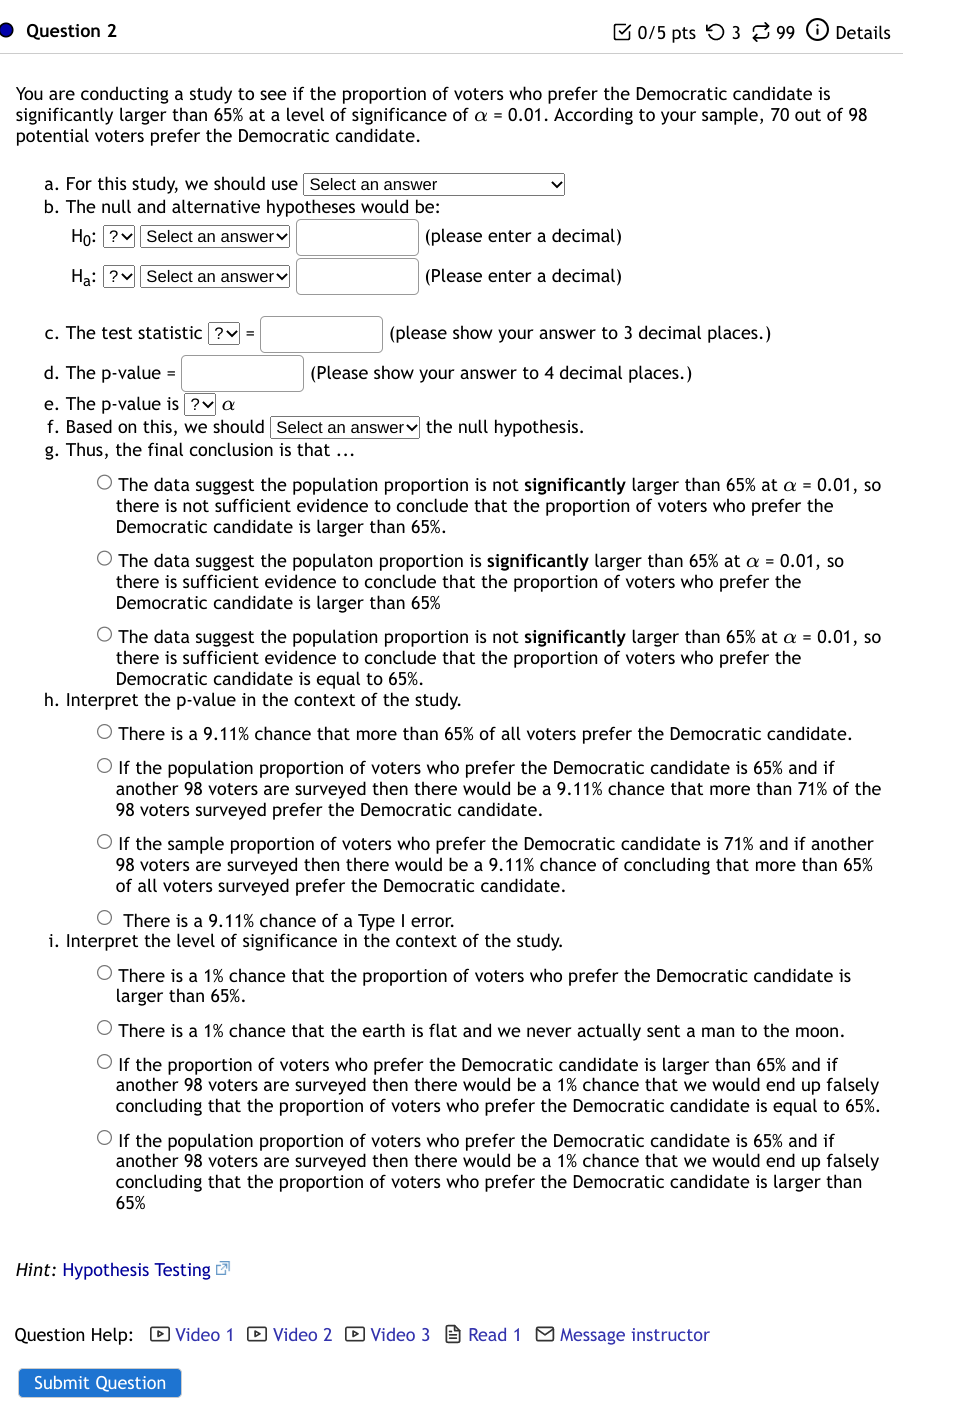
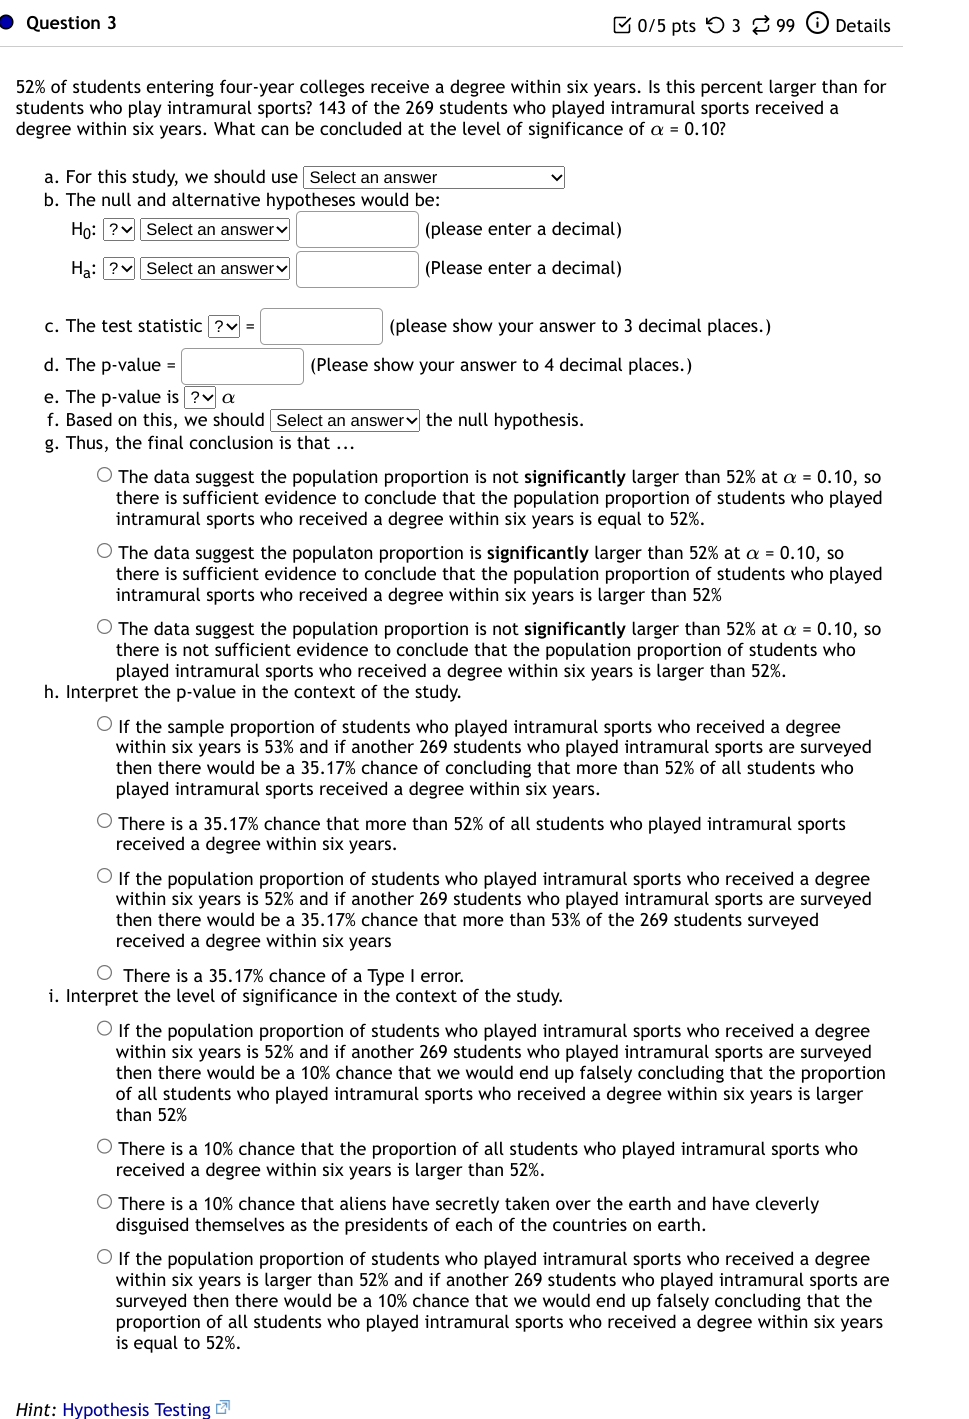
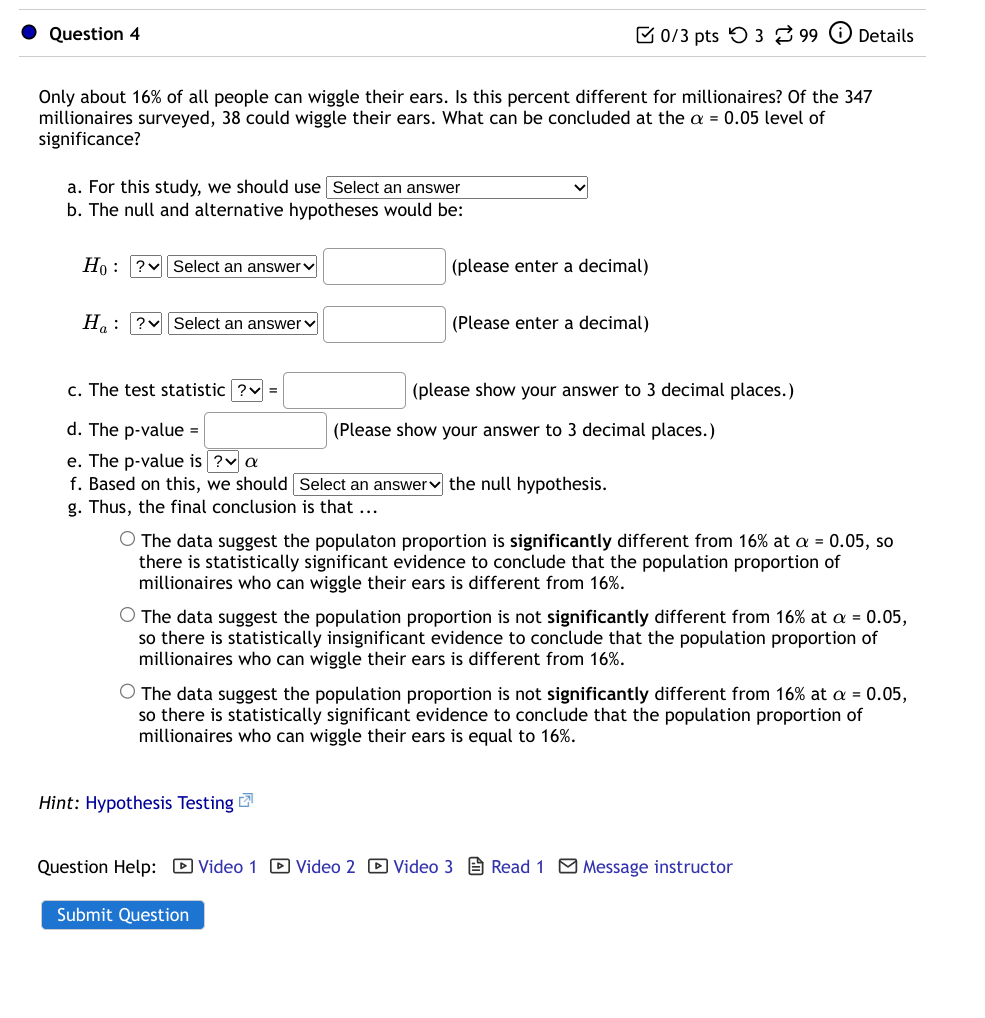
0 Question 1 E4 015 pts '0 3 3 99 G) Details You are conducting a study to see if the proportion of voters who prefer the Democratic candidate is significantly smaller than 69% at a level of significance of a = 0.10. According to your sample, 60 out of 93 potential voters prefer the Democratic candidate. a. For this study, we should use | Select an answer v| b. The null and alternative hypotheses would be: He: l l (please enter a decimal) Ha: ' ' (Please enter a decimal) c. The test statistic =' I {please show your answer to 3 decimal places.) d. The p-value =' ' {Please show your answer to 4 decimal places.) e. The p-value is a f. Based on this, we should the null hypothesis. g. Thus, the final conclusion is that C} The data suggest the population proportion is not significantly smaller than 69% at a = 0.10, so there is sufficient evidence to conclude that the proportion of voters who prefer the Democratic candidate is equal to 69%. {I} The data suggest the populaton proportion is significantly smaller than 69% at a = 0.10, so there is sufficient evidence to conclude that the proportion of voters who prefer the Democratic candidate is smaller than 69% C} The data suggest the population proportion is not significantly smaller than 69% at C! = 0.10, so there is not sufficient evidence to conclude that the proportion of voters who prefer the Democratic candidate is smaller than 69%. h. Interpret the p-value in the context of the study. {3' If the population proportion of voters who prefer the Democratic candidate is 69% and if another 93 voters are surveyed then there would be a 17.49% chance fewer than 64% of the 93 voters surveyed prefer the Democratic candidate. {3' There is a 69% chance of a Type I error. 0 If the sample proportion of voters who prefer the Democratic candidate is 64% and if another 93 voters are surveyed then there would be a 17.49% chance of concluding that fewer than 69% of all voters surveyed prefer the Democratic candidate. 0 There is a 17.49% chance that fewer than 69% of all voters prefer the Democratic candidate. i. Interpret the level of significance in the context of the study. {3' If the proportion of voters who prefer the Democratic candidate is smaller than 69% and if another 93 voters are surveyed then there would be a 10% chance that we would end up falsely concluding that the proportion of voters who prefer the Democratic candidate is equal to 69%. C} There is a 10% chance that the earth is flat and we never actually sent a man to the moon. {3' There is a 10% chance that the proportion of voters who prefer the Democratic candidate is smaller than 69%. '3' If the population proportion of voters who prefer the Democratic candidate is 69% and if another 93 voters are surveyed then there would be a 10% chance that we would end up falsely concluding that the proportion of voters who prefer the Democratic candidate is smaller than 69% Hint: Hypothesis Testing C Question Help: El Video 1 El Video 2 El Video 3 I; Read 1 8 Message instructor Submit Question 0 Question 2 E4 015 pts '0 3 Z 99 6) Details You are conducting a study to see if the proportion of voters who prefer the Democratic candidate is significantly larger than 65% at a level of significance of a = 0.01. According to your sample, 70 out of 98 potential voters prefer the Democratic candidate. a. For this study, we should use Select an answer v b. The null and alternative hypotheses would be: H0: l l (Please enter a decimal) Ha: ' ' (Please enter a decimal) c. The test statistic =' l {please show your answer to 3 decimal places.) d. The p-value =' ' {Please show your answer to 4 decimal places.) e. The p-value is a f. Based on this, we should the null hypothesis. g. Thus, the final conclusion is that O The data suggest the population proportion is not significantly larger than 65% at a = 0.01, so there is not sufficient evidence to conclude that the proportion of voters who prefer the Democratic candidate is larger than 65%. O The data suggest the populaton proportion is significantly larger than 65% at or = 0.01, so there is sufficient evidence to conclude that the proportion of voters who prefer the Democratic candidate is larger than 65% O The data suggest the population proportion is not significantly larger than 65% at a = 0.01, so there is sufficient evidence to conclude that the proportion of voters who prefer the Democratic candidate is equal to 65%. h. Interpret the p-value in the context of the study. {3' There is a 9.11% chance that more than 65% of all voters prefer the Democratic candidate. {3' If the population proportion of voters who prefer the Democratic candidate is 65% and if another 98 voters are surveyed then there would be a 9.11% chance that more than 71% of the 98 voters surveyed prefer the Democratic candidate. C} If the sample proportion of voters who prefer the Democratic candidate is 71% and if another 98 voters are surveyed then there would be a 9.11% chance of concluding that more than 65% of all voters surveyed prefer the Democratic candidate. {3' There is a 9.11% chance of a Type I error. i. Interpret the level of significance in the context of the study. {3' There is a 1% chance that the proportion of voters who prefer the Democratic candidate is larger than 65%. '3' There is a 1% chance that the earth is flat and we never actually sent a man to the moon. {3' If the proportion of voters who prefer the Democratic candidate is larger than 65% and if another 98 voters are surveyed then there would be a 1% chance that we would end up falsely concluding that the proportion of voters who prefer the Democratic candidate is equal to 65%. {3' If the population proportion of voters who prefer the Democratic candidate is 65% and if another 98 voters are surveyed then there would be a 1% chance that we would end up falsely concluding that the proportion of voters who prefer the Democratic candidate is larger than 65% Hint: Hypothesis Testing E Question Help: El Video 1 El Video 2 El Video 3 [3 Read 1 8 Message instructor Submit Question 0 Question 3 E4 015 pts '0 3 Z 99 6) Details 52% of students entering four-year colleges receive a degree within six years. Is this percent larger than for students who play intramural sports? 143 of the 269 students who played intramural sports received a degree within six years. What can be concluded at the level of significance of a = 0.10? a. For this study, we should use | Select an answer v| b. The null and alternative hypotheses would be: H0: l l (Please enter a decimal) Ha: ' ' (Please enter a decimal) c. The test statistic =' l {please show your answer to 3 decimal places.) d. The p-value =' ' {Please show your answer to 4 decimal places.) e. The p-value is a f. Based on this, we should the null hypothesis. g. Thus, the final conclusion is that {I} The data suggest the population proportion is not significantly larger than 52% at a = 0.10, so there is sufficient evidence to conclude that the population proportion of students who played intramural sports who received a degree within six years is equal to 52%. C} The data suggest the populaton proportion is significantly larger than 52% at or = 0.10, so there is sufficient evidence to conclude that the population proportion of students who played intramural sports who received a degree within six years is larger than 52% C} The data suggest the population proportion is not significantly larger than 52% at a = 0.10, so there is not sufficient evidence to conclude that the population proportion of students who played intramural sports who received a degree within six years is larger than 52%. h. Interpret the p-value in the context of the study. {.3' If the sample proportion of students who played intramural sports who received a degree within six years is 53% and if another 269 students who played intramural sports are surveyed then there would be a 35.17% chance of concluding that more than 52% of all students who played intramural sports received a degree within six years. '3' There is a 35.17% chance that more than 52% of all students who played intramural sports received a degree within six years. '3' If the population proportion of students who played intramural sports who received a degree within six years is 52% and if another 269 students who played intramural sports are surveyed then there would be a 35.17% chance that more than 53% of the 269 students surveyed received a degree within six years {3' There is a 35.17% chance of a Type I error. i. Interpret the level of significance in the context of the study. 0 If the population proportion of students who played intramural sports who received a degree within six years is 52% and if another 269 students who played intramural sports are surveyed then there would be a 10% chance that we would end up falsely concluding that the proportion of all students who played intramural sports who received a degree within six years is larger than 52% 0 There is a 10% chance that the proportion of all students who played intramural sports who received a degree within six years is larger than 52%. C} There is a 10% chance that aliens have secretly taken over the earth and have cleverly disguised themselves as the presidents of each of the countries on earth. C} If the population proportion of students who played intramural sports who received a degree within six years is larger than 52% and if another 269 students who played intramural sports are surveyed then there would be a 10% chance that we would end up falsely concluding that the proportion of all students who played intramural sports who received a degree within six years is equal to 52%. Hint: Hypothesis Testing C 0 Question 4 E 013 pts '0 3 3 99 6) Details Only about 16% of all people can wiggle their ears. Is this percent different for millionaires? 0f the 347 millionaires surveyed, 38 could wiggle their ears. What can be concluded at the a = 0.05 level of significance? a. For this study, we should use Select an answer v D. The null and alternative hypotheses would be: H0 : ' ltplease enter a decimal} Ha : ' I (Please enter a decimal] c. The test statistic =' I {please show your answer to 3 decimal places.) d. The p-yalue = ' ' {Please show your answer to 3 decimal places.) e. The p-yalue is Ct f. Based on this, we should the null hypothesis. g. Thus, the final conclusion is that C) The data suggest the populaton proportion is significantly different from 16% at o: = 0.05, so there is statistically significant evidence to conclude that the population proportion of millionaires who can wiggle their ears is different from 16%. O The data suggest the population proportion is not significantly different from 16% at c: = 0.05, so there is statistically insignificant evidence to conclude that the population proportion of millionaires who can wiggle their ears is different from 16%. O The data suggest the population proportion is not significantly different from 16% at a = 0.05, so there is statistically significant evidence to conclude that the population proportion of millionaires who can wiggle their ears is equal to 16%. Hint: Hypothesis Testing E Question Help: El Video 1 El Video 2 El Video 3 El Read 1 8 Message instructor Submit
Step by Step Solution
There are 3 Steps involved in it

Get step-by-step solutions from verified subject matter experts