

Question: 0 Question 11 B 0/1 pt '0 3 8 98 6) Details Using your favorite statistics software package, you generate a scatter plot with a

![in the values of x? r2 =:]% Report answer as a percentage](https://s3.amazonaws.com/si.experts.images/answers/2024/06/6668f50481535_5006668f5045c495.jpg)


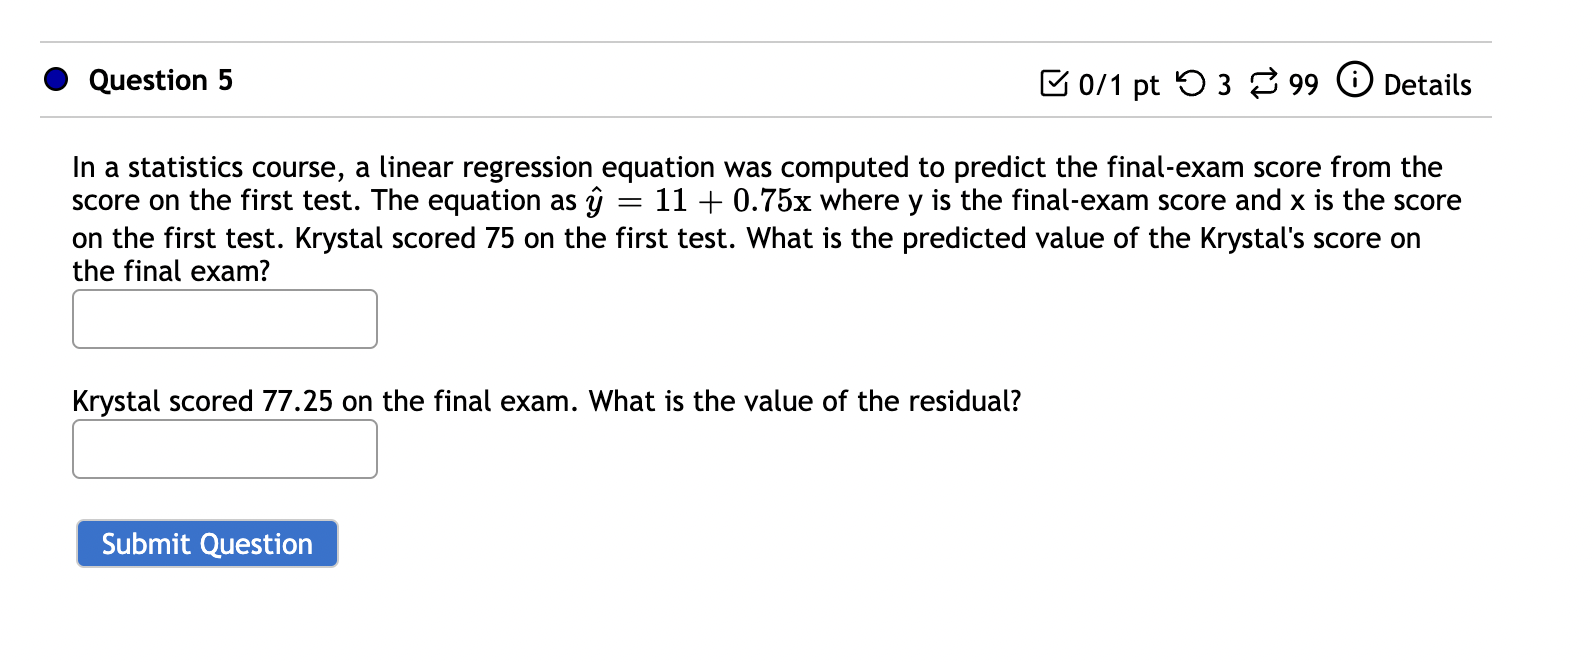


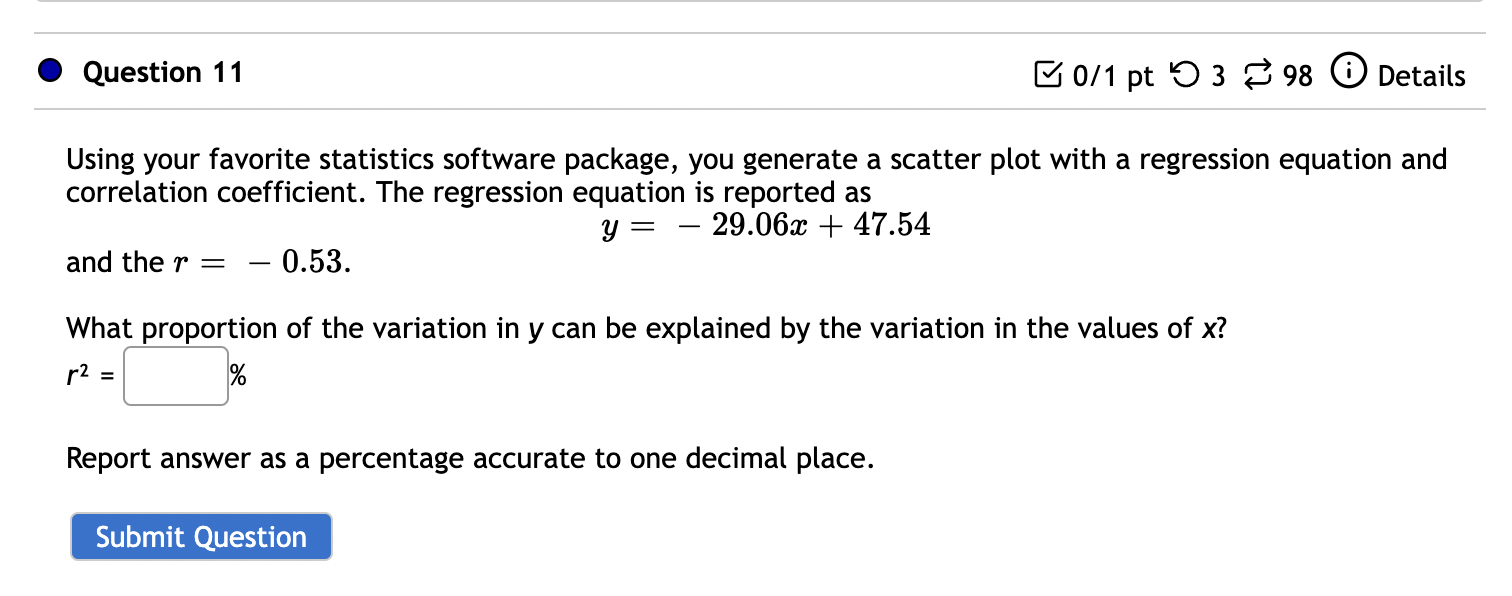
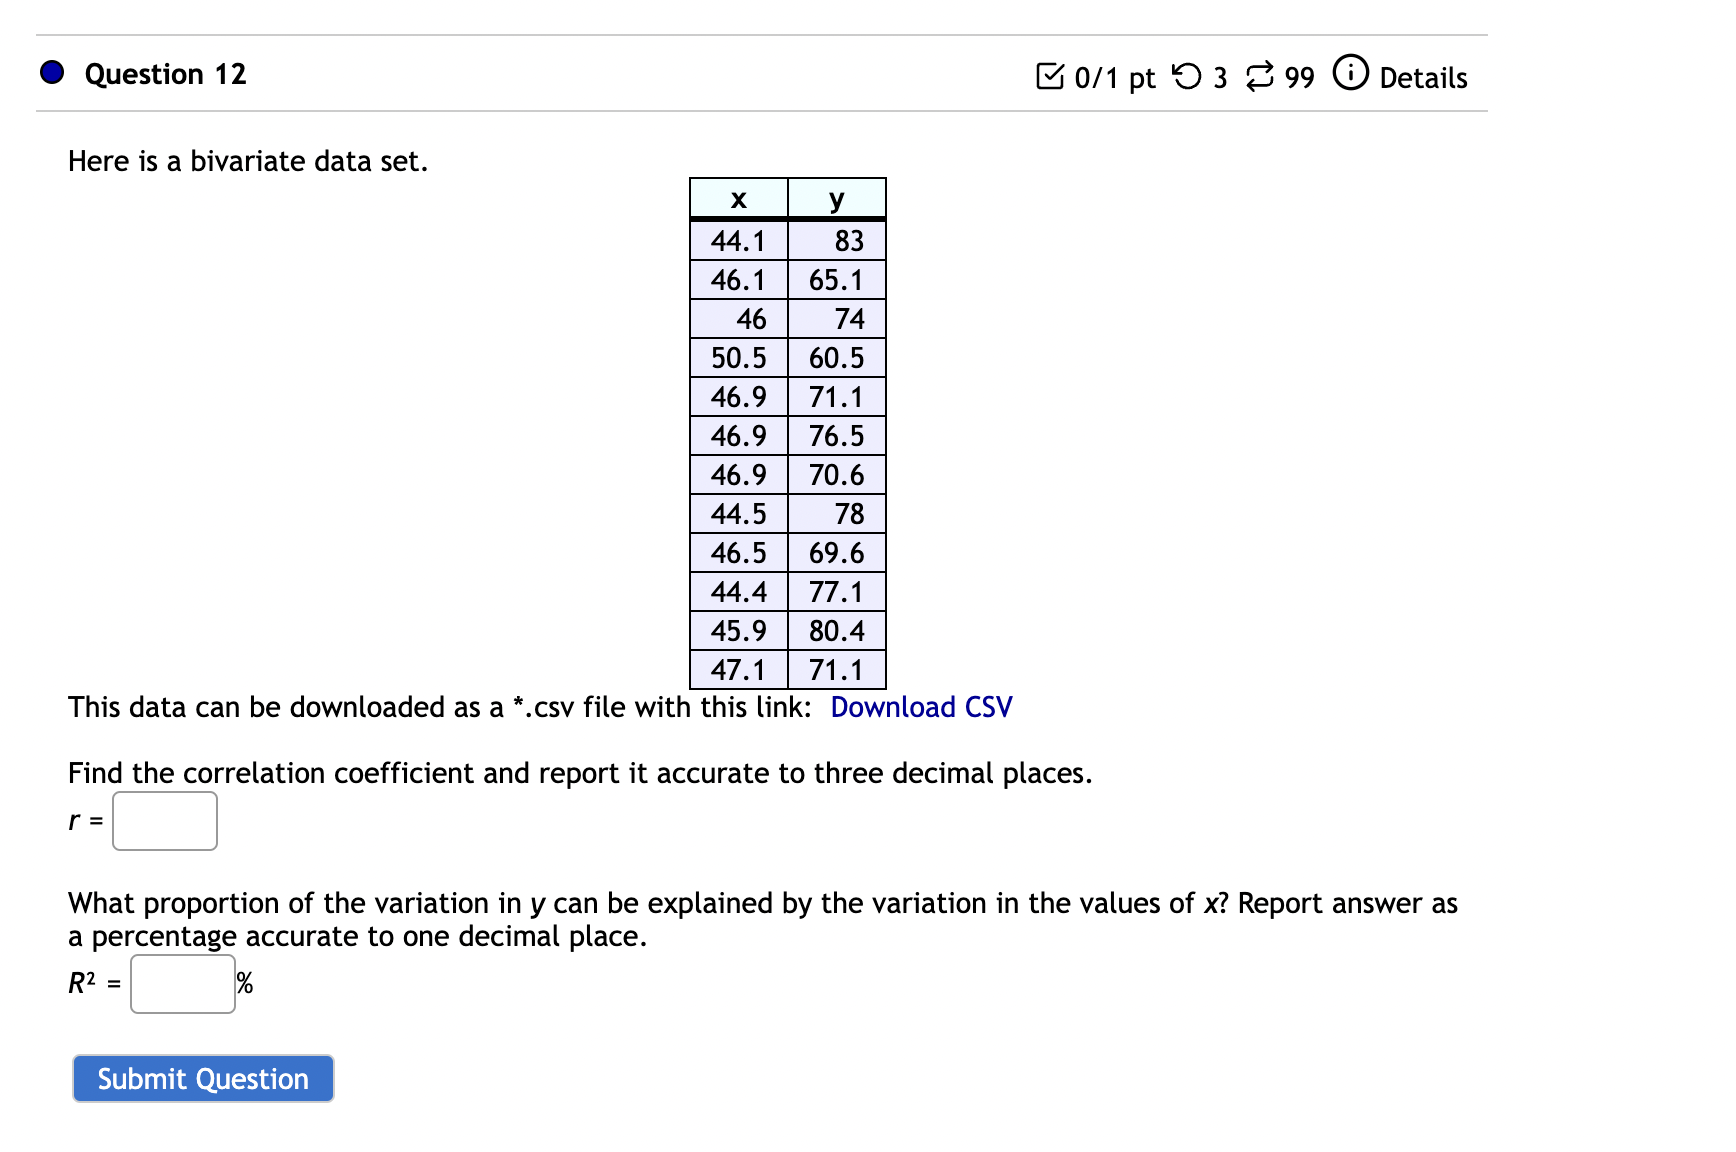
0 Question 11 B 0/1 pt '0 3 8 98 6) Details Using your favorite statistics software package, you generate a scatter plot with a regression equation and correlation coefficient. The regression equation is reported as y = 29.06% + 47.54 and the 1' = 0.53. What proportion of the variation in y can be explained by the variation in the values of x? r2 =:]% Report answer as a percentage accurate to one decimal place. Submit Question 0 Question 12 IE 0/1 pt '0 3 8 99 G Details Here is a bivariate data set. ix ' m'
Step by Step Solution
There are 3 Steps involved in it
1 Expert Approved Answer
Step: 1 Unlock

Question Has Been Solved by an Expert!
Get step-by-step solutions from verified subject matter experts
Step: 2 Unlock
Step: 3 Unlock