

Question: 0 Question 11 v Assume that a sample is used to estimate a population proportion p. To find the 90% confidence interval for a sample


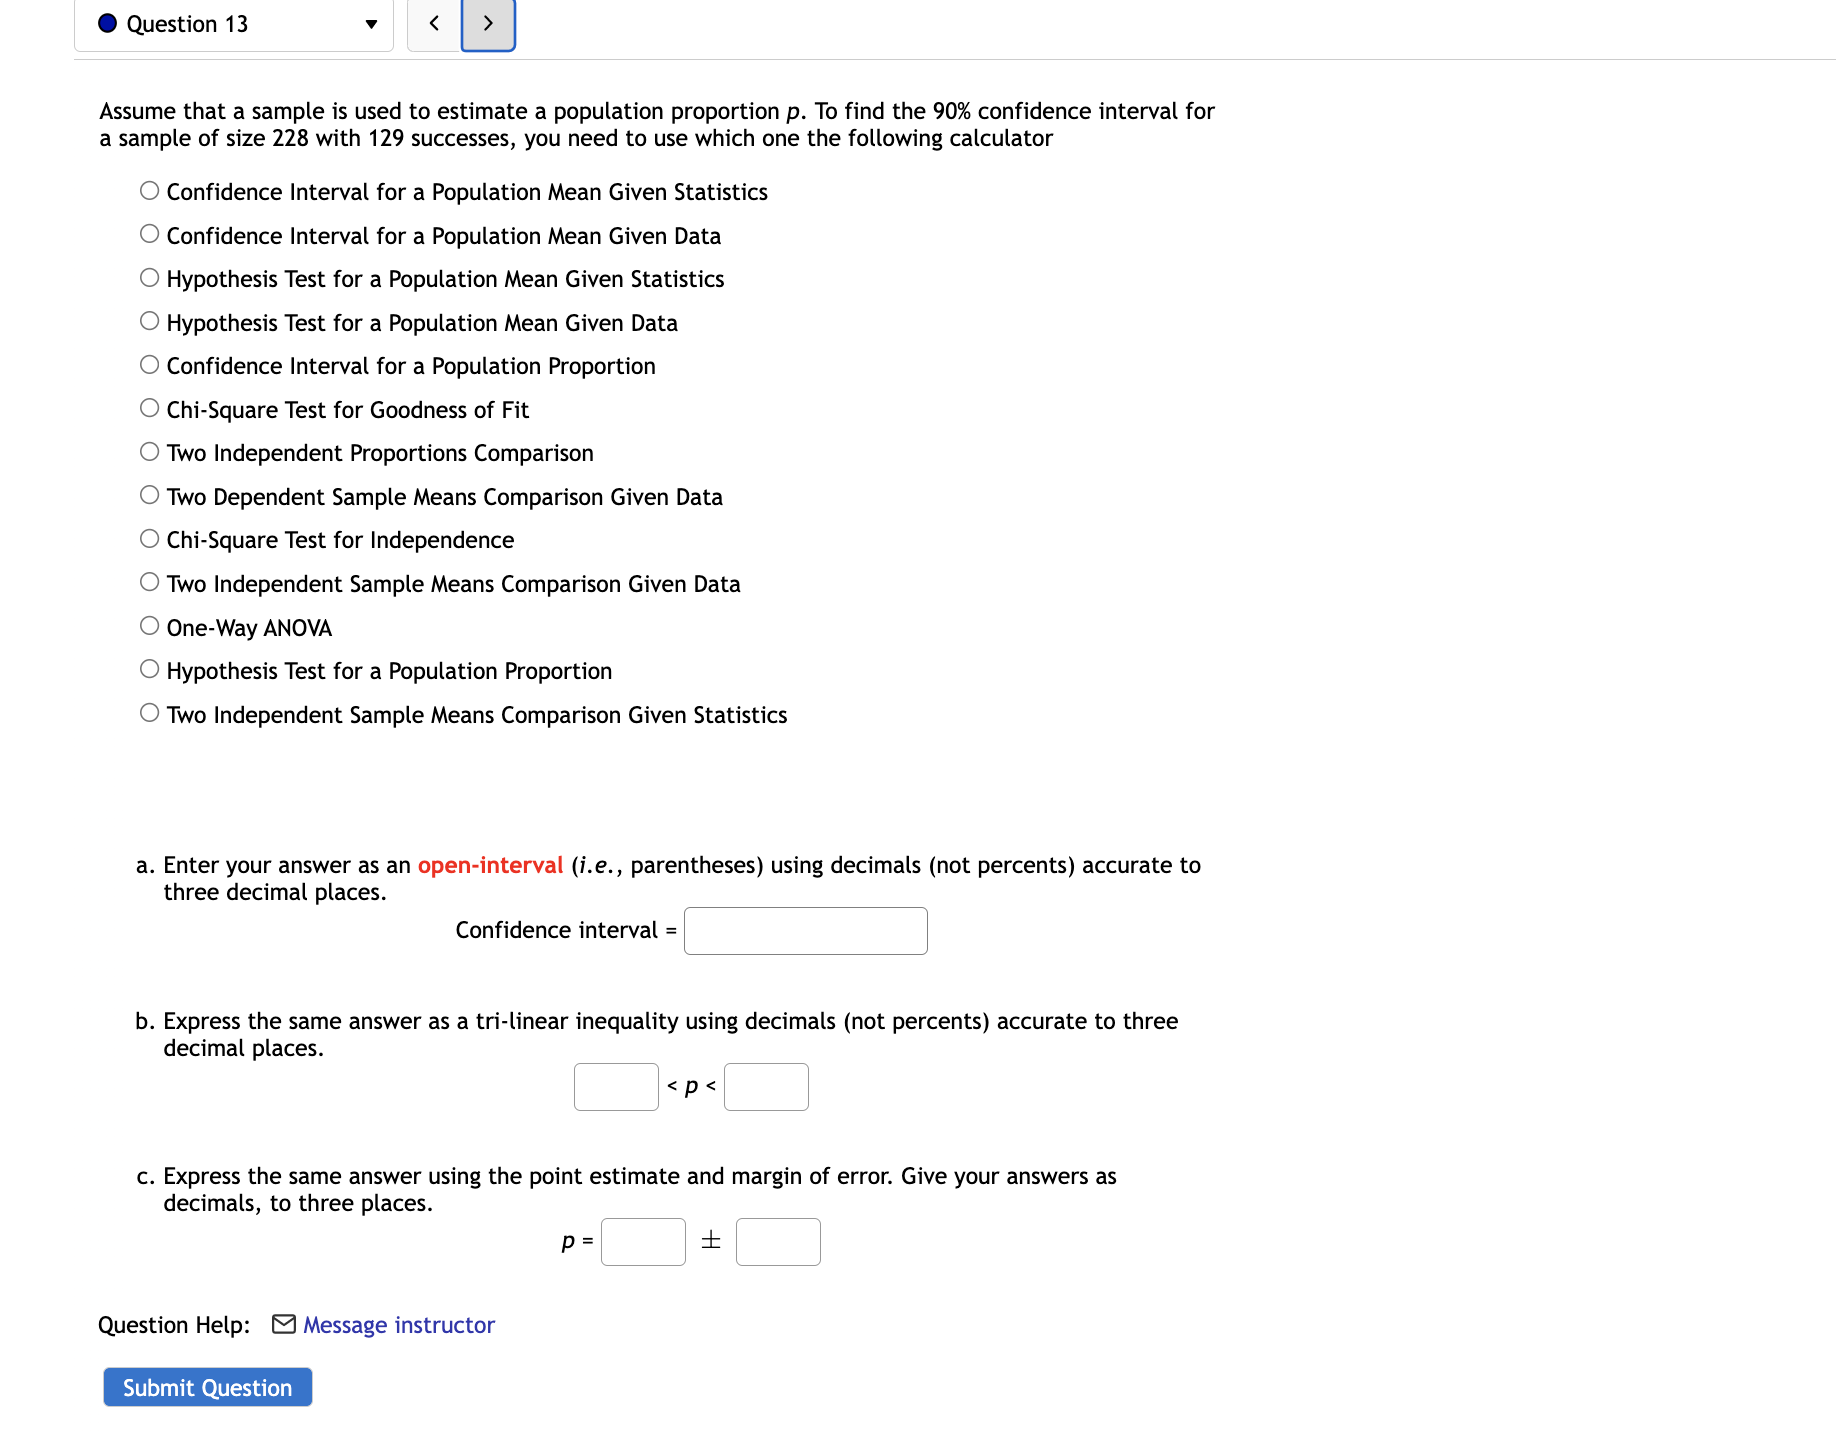


0 Question 11 v Assume that a sample is used to estimate a population proportion p. To find the 90% confidence interval for a sample of size 228 with 129 successes, you need to use which one the following calculator 0 Confidence Interval for a Population Mean Given Statistics 0 Confidence Interval for a Population Mean Given Data 0 Hypothesis Test for a Population Mean Given Statistics 0 Hypothesis Test for a Population Mean Given Data O Confidence Interval for a Population Proportion O Chi-Square Test for Goodness of Fit O Two Independent Proportions Comparison 0 Two Dependent Sample Means Comparison Given Data 0 ChiSquare Test for Independence O Two Independent Sample Means Comparison Given Data 0 One-Way ANOVA O Hypothesis Test for a Population Proportion O Two Independent Sample Means Comparison Given Statistics a. Enter your answer as an open-interval (i.e., parentheses) using decimals (not percents) accurate to three decimal places. Confidence interval = I b. Express the same answer as a tri-linear inequality using decimals (not percents) accurate to three decimal places.
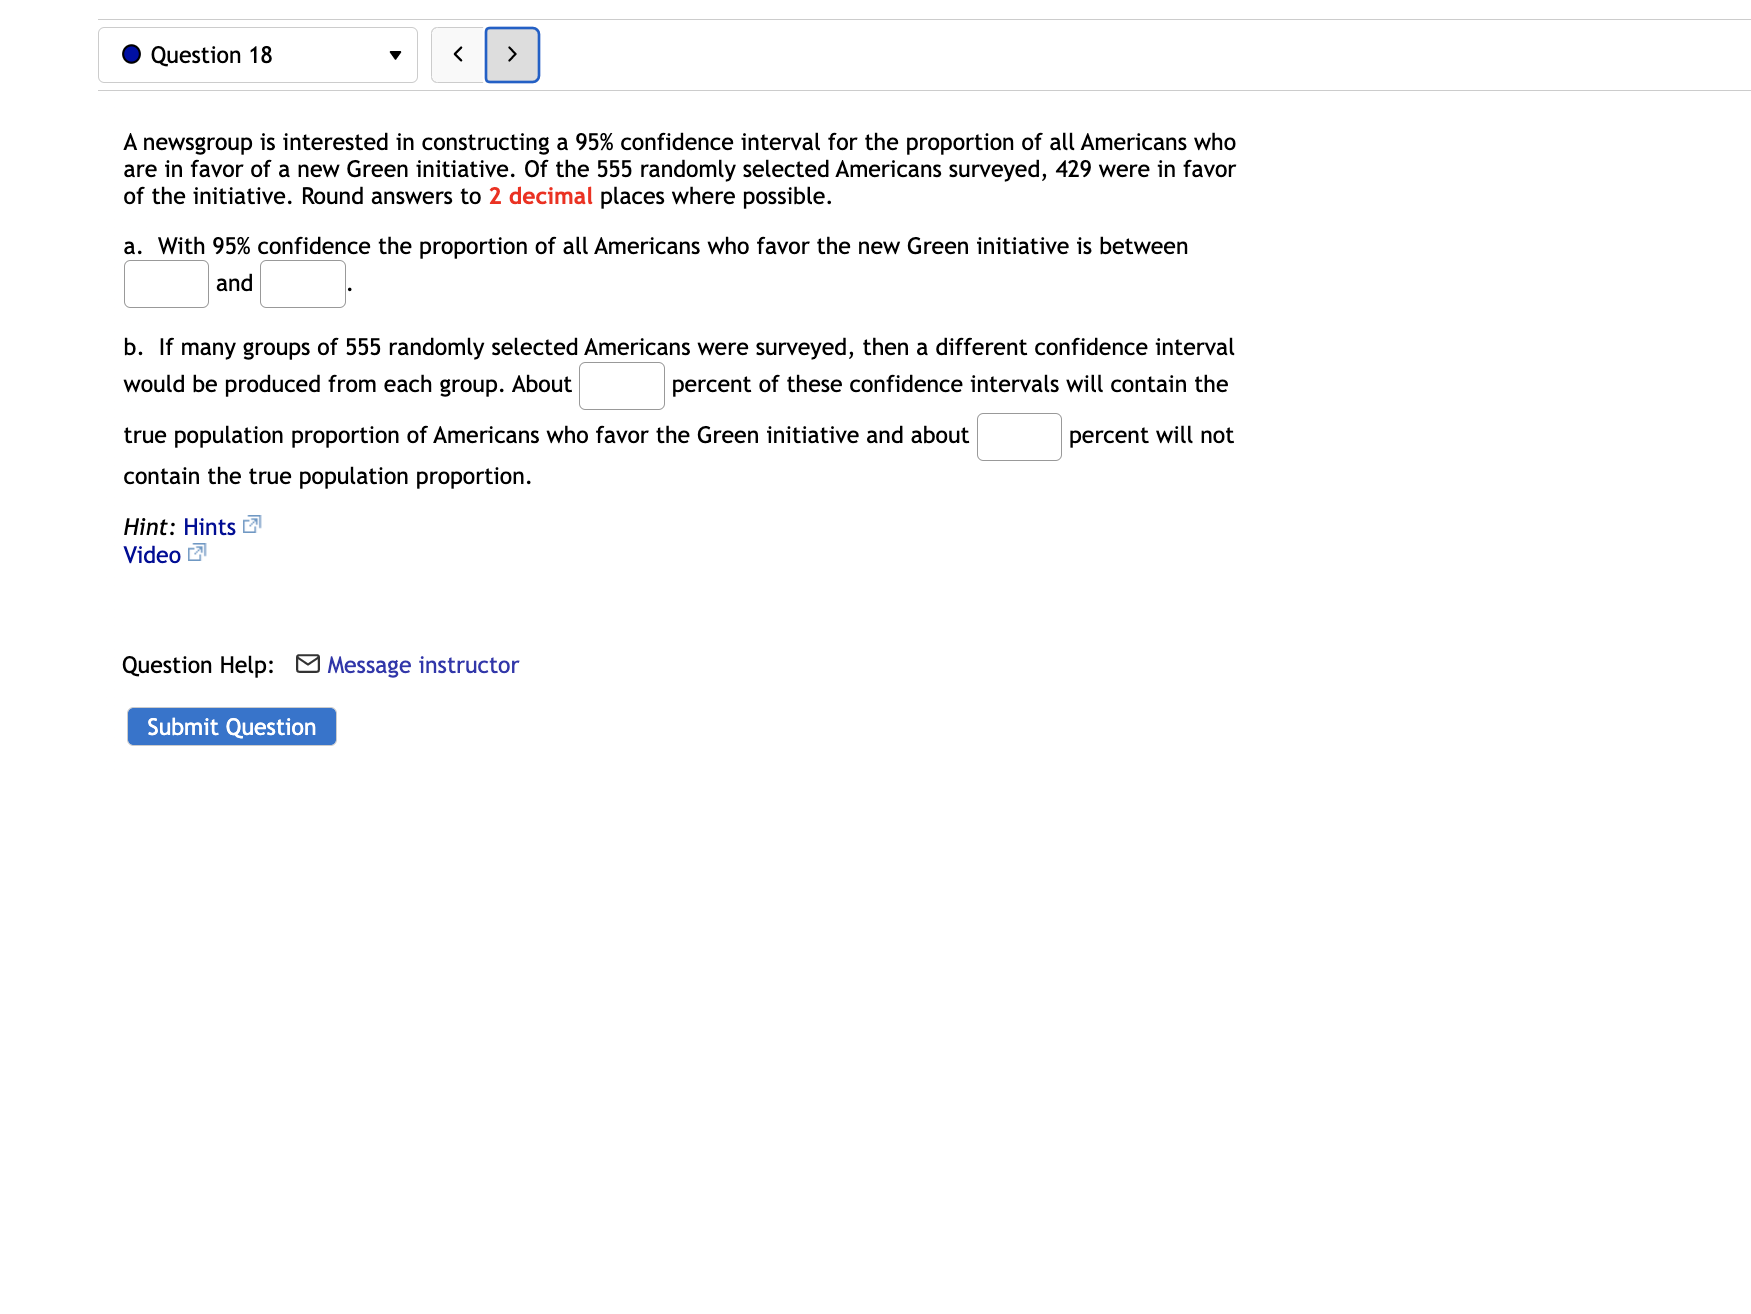
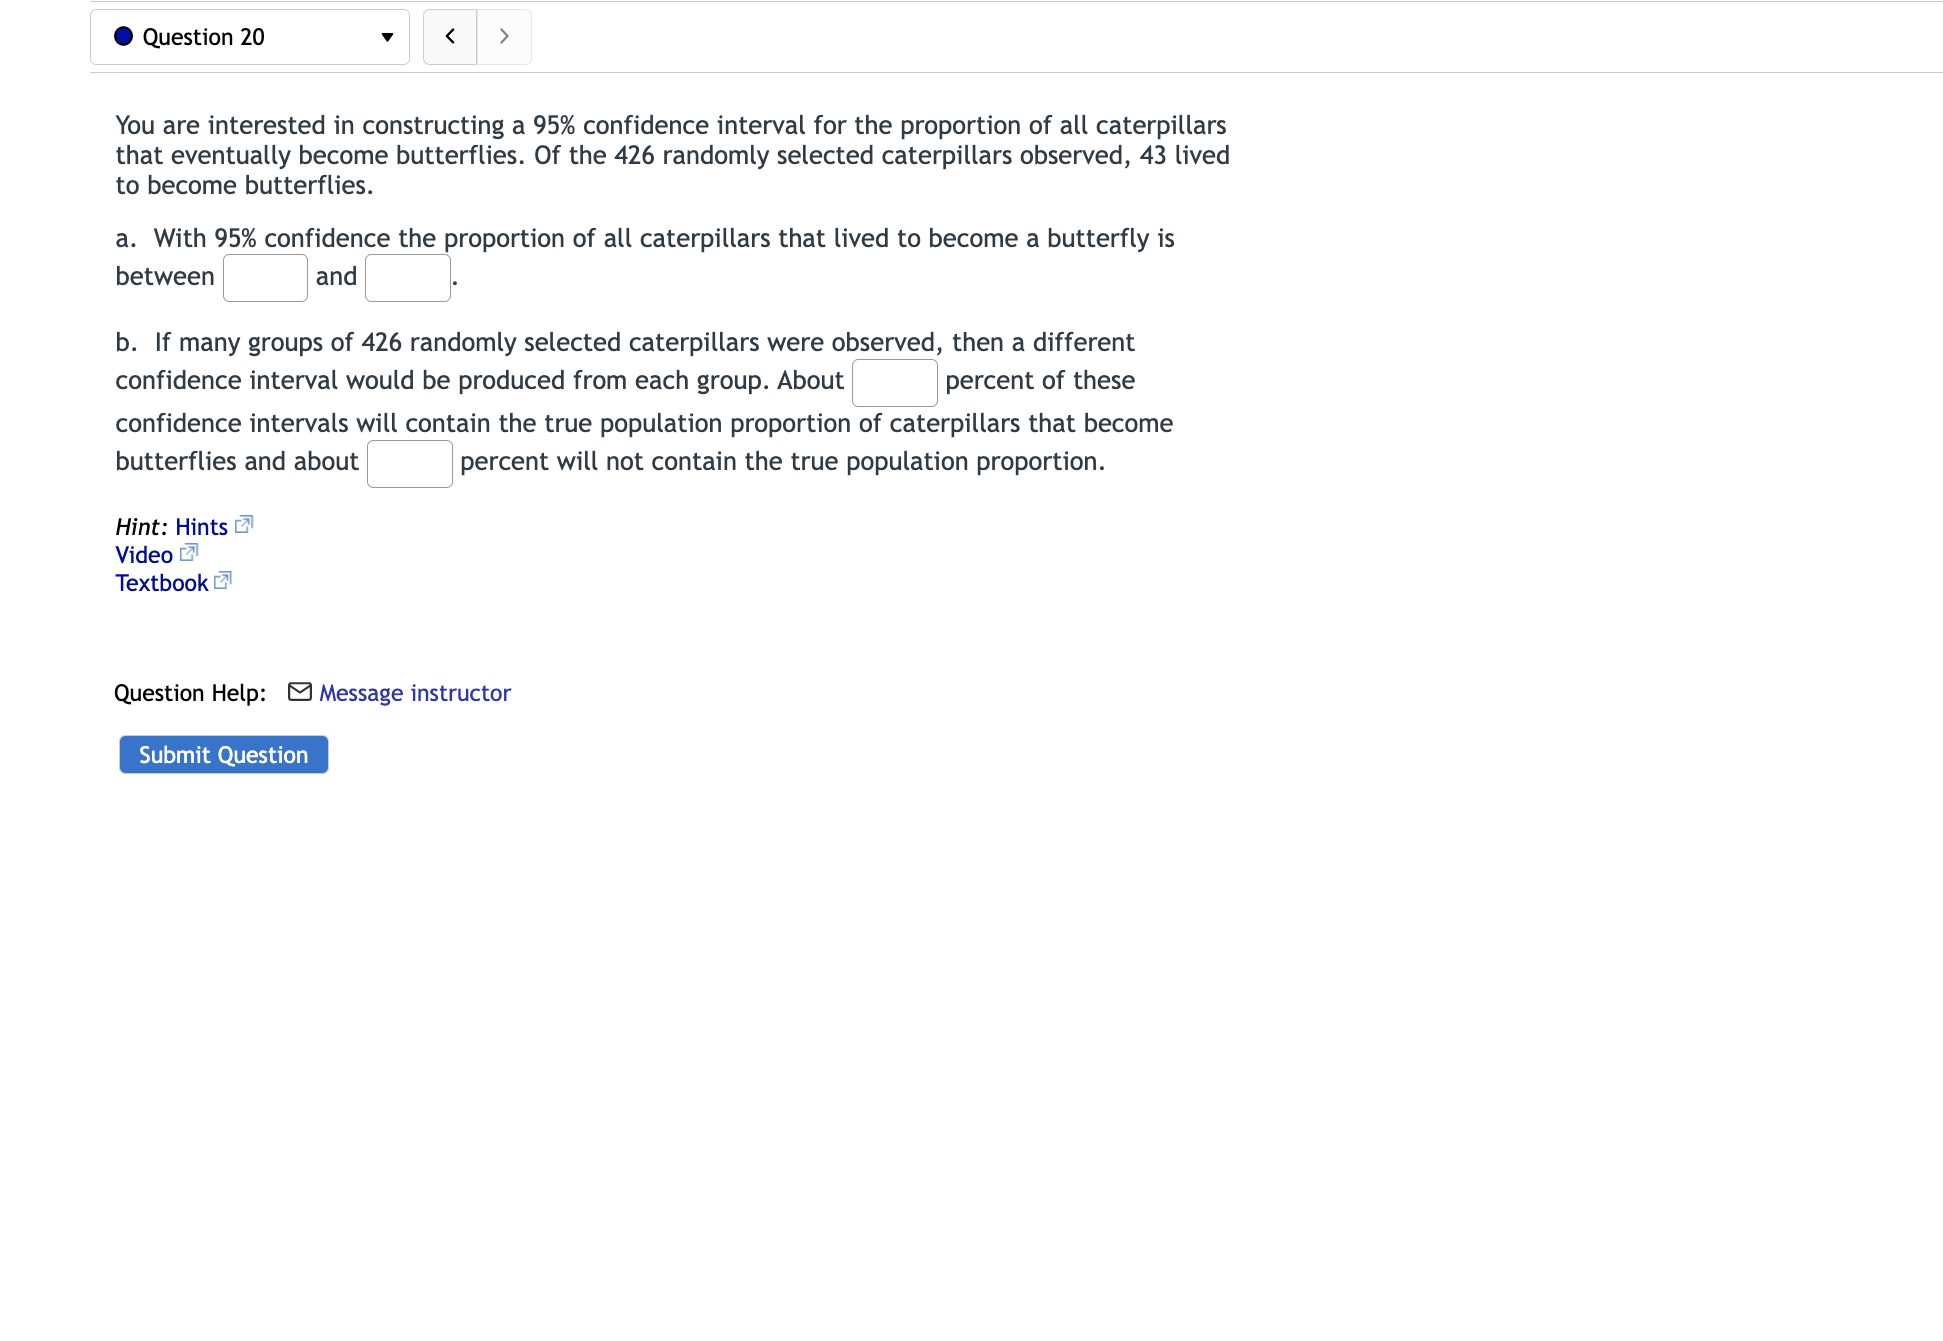
You are interested in constructing a 95% confidence interval for the proportion of all caterpillars that eventually become butterflies. Of the 426 randomly selected caterpillars observed, 43 lived to become butterflies. a. With 95% confidence the proportion of all caterpillars that lived to become a butterfly is between l land ' i. b. If many groups of 426 randomly selected caterpillars were observed, then a different confidence interval would be produced from each group. Aboutl percent of these confidence intervals will contain the true population proportion of caterpillars that become butterflies and about i ' percent will not contain the true population proportion. Hint: Hints E Video 5' Textbook E Question Help: 8 Message instructor Submit
Step by Step Solution
There are 3 Steps involved in it

Get step-by-step solutions from verified subject matter experts