

Question: 0 Question 13 v The table below shows the number of state-regis.ered automatic weapons and the murder rate for several Northwestern states. no 11.? 8.1
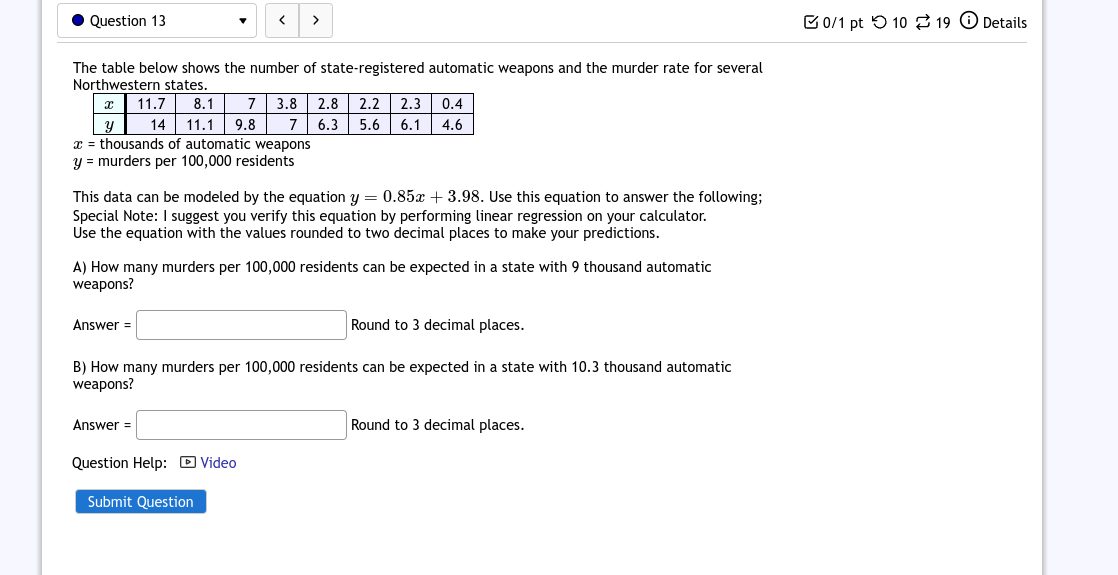
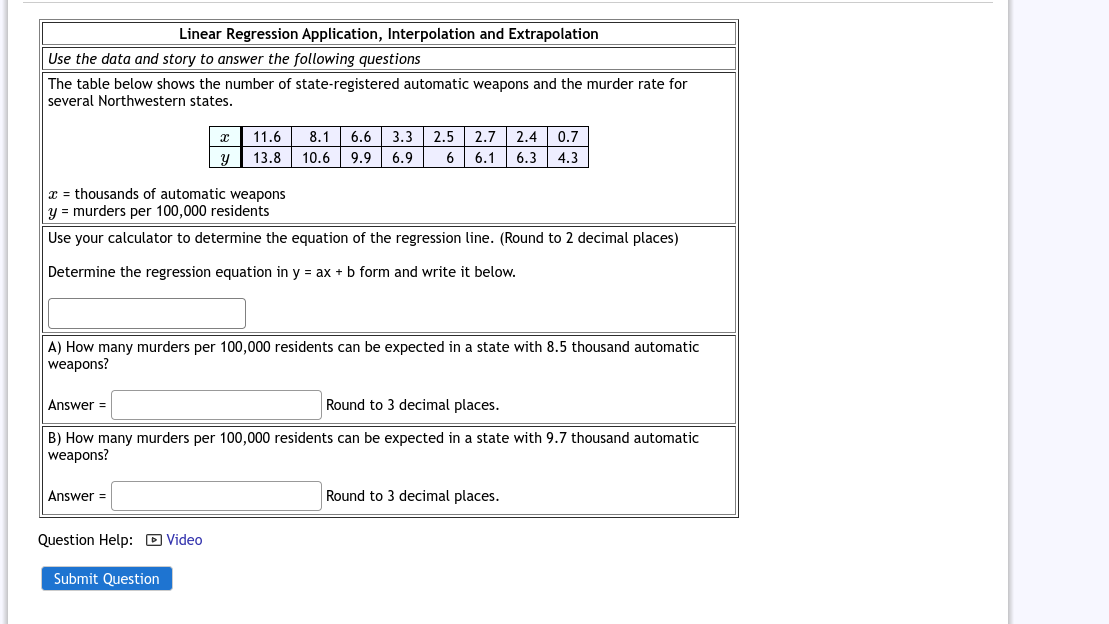
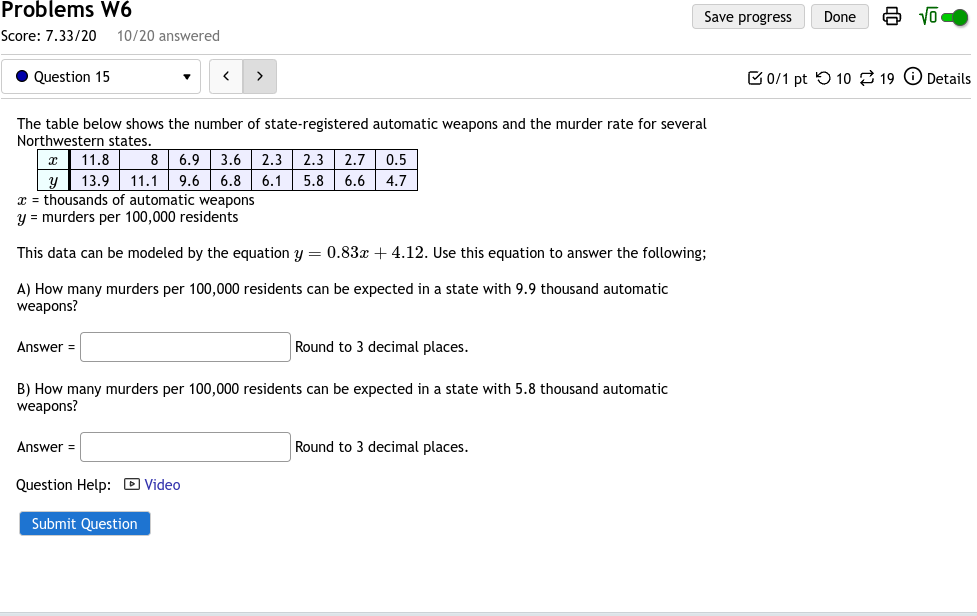
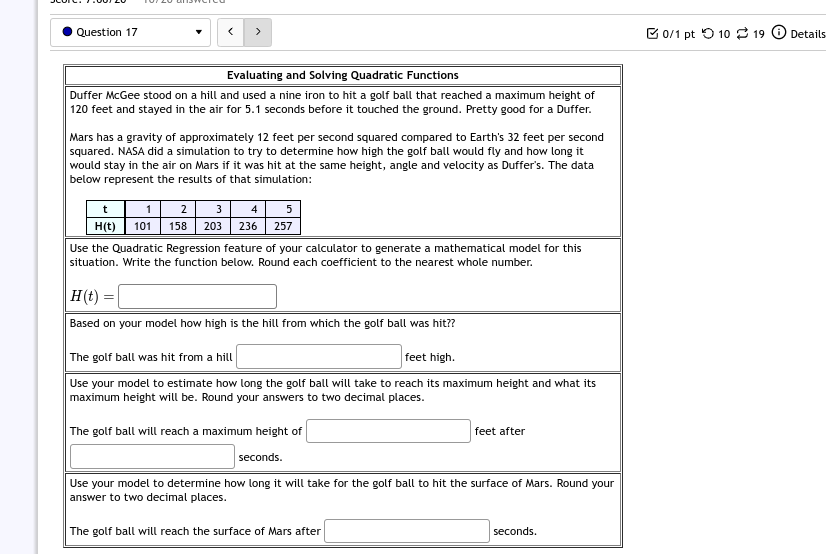
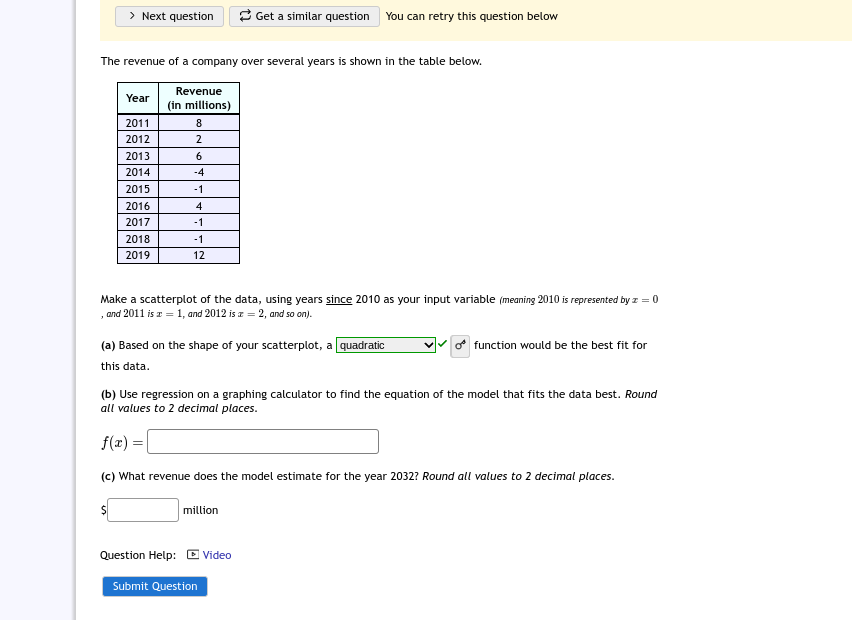
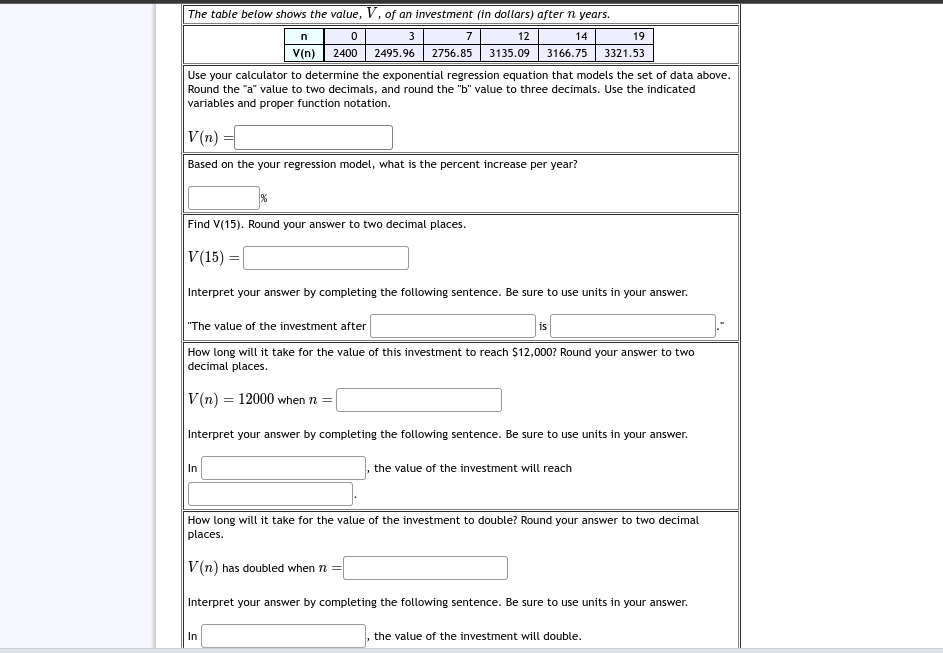
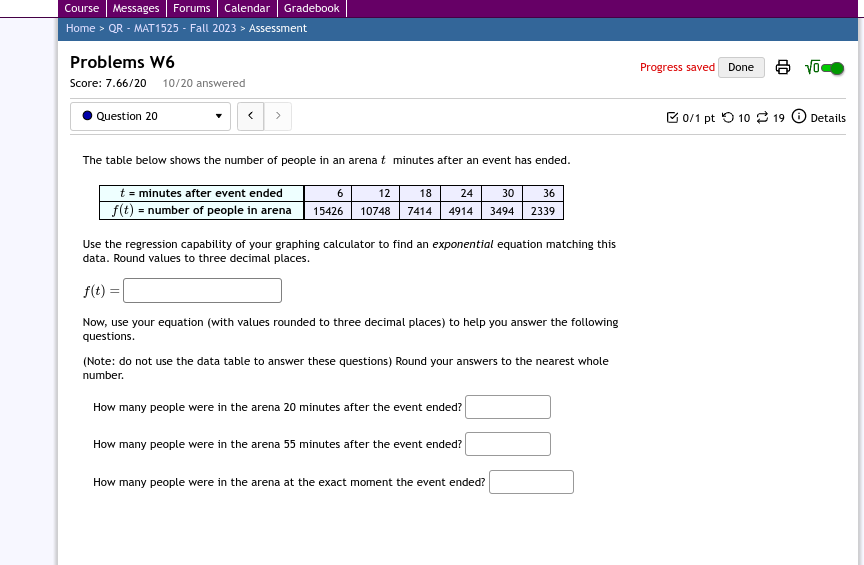
0 Question 13 v The table below shows the number of state-regis.ered automatic weapons and the murder rate for several Northwestern states. no 11.? 8.1 ? 3.8 2.8 2.2 2.3 0.4 y 14 11.1 9.8 3' 0.3 5.6 6.1 4.6 a: = thousands of automatic weapons 3,: = murders per 100,000 residents Th's data can be modeled by the equation 3,: = 0.85m + 3.98. Use this equation to answer the following; Special Note: I suggest you verify this equation by performing linear regression on your calculator. Use the equation with the values rounded to two decimal places to make your predictions. A) How many murders per 100,000 residents can be expected in a state with 9 thousand automatic weapons? Answer =- I Round to 3 decimal places. B} How many murders per 100,000 residents can be expected in a state with 10.3 thousand automatic weapons? Answer =| Round to 3 decimal places. Question Help: [E] Video Submit Question Eon pt 010 319 Details Linear Regression Application, Interpolation and Extrapolation Use the data and story to answer the following questions The table below shows the number of stateregistered automatic weapons and the murder rate for several Northwestern states. a: 11.6 8.1 6.6 3.3 2.5 2.? 2.4 0.? y 13.8 10.6 9.9 6.9 6 6.1 6.3 4.3 m = thousands of automatic weapons 3,: = murders per 100,000 residents Use your calculator to determine the equation of the regression line. [Round to 2 decimal places) Determine the regression equation in y = ax + b form and write it below. A) How many murders per 100,000 residents can be expected in a state with 8.5 thousand automatic weapons? Answer = I I Round to 3 decimal places. B} How many murders per 100,000 residents can be expected in a state with 9.? thousand automatic weapons? Answer = I I Round to 3 decimal places. Question Help: [E] Video Submit Question Problems W6 Score: 7.33190 10120 answered Save progress Done IE] 15" 0 Question 15 v Next question Get a similar question You can retry this question below The revenue of a company over several years is shown in the table below. Year Revenue (in millions) 2011 8 2012 2 2013 6 2014 -4 2015 -1 2016 4 2017 -1 2018 -1 2019 12 Make a scatterplot of the data, using years since 2010 as your input variable (meaning 2010 is represented by z = 0 and 2011 is a = 1, and 2012 is x = 2, and so on). (a) Based on the shape of your scatterplot, a quadratic vv of function would be the best fit for this data. (b) Use regression on a graphing calculator to find the equation of the model that fits the data best. Round all values to 2 decimal places. f(x) = (c) What revenue does the model estimate for the year 20327 Round all values to 2 decimal places. million Question Help: @Video Submit QuestionThe table below shows the value. V. of on investment (in dollars] after 1': years. n O 3 I" 12 14 19 n} 1400 2495.96 1756.85 3135.l]\"3I 3166.35 3321.53 Use your calculator to determine the exponential regression equation that models the set of data above. Flound the 'a' value to two decimals. and round the "b" value to three decimals. Use the indicated variables and proper function notation. V0} =:I Based on the your regression model. what is the percent increase per year? | I. Find V115}. Round 1your answer to two decimal places. 0115) = | | Interpret your answer by completing the following sentence. Be sure to use units in your answer. "The value of the investment after I IisI .' How long will it take for the value of this investment to reach 512,000? Round your answer to two decimal places. V01} = 12000 when n =| | Interpret your answer by completing the following sentence. Be sure to use units in your answer. In I I. the value of the investment will reach How long will it take for the value of the investment to double? Flound your answer to two decimal places. V{n} has doubled when n =I Interpret your answer by completing the following sentence. Be sure to use units in your answer. In I I. the value of the investment will double. Course | Messages | Forums | Calendar | Gradebook Home > QR - MAT1525 - Fall 2023 > Assessment Problems W6 Progress saved Done Score: 7.66/20 10/20 answered . Question 20 0/1 pt O 10 - 19 0 Details The table below shows the number of people in an arena t minutes after an event has ended. t = minutes after event ended 6 12 18 24 30 36 f(t) = number of people in arena 15426 10748 7414 4914 3494 2339 Use the regression capability of your graphing calculator to find an exponential equation matching this data. Round values to three decimal places. f (t) = Now, use your equation (with values rounded to three decimal places) to help you answer the following questions. (Note: do not use the data table to answer these questions) Round your answers to the nearest whole number. How many people were in the arena 20 minutes after the event ended? How many people were in the arena 55 minutes after the event ended? How many people were in the arena at the exact moment the event ended
Step by Step Solution
There are 3 Steps involved in it

Get step-by-step solutions from verified subject matter experts