

Question: 0 Question 22 v Frequency 22.5 30.5 38.5 45.5 54.5 62.5 70.5 Ages Q Use the random sample data in the graph above to answer:
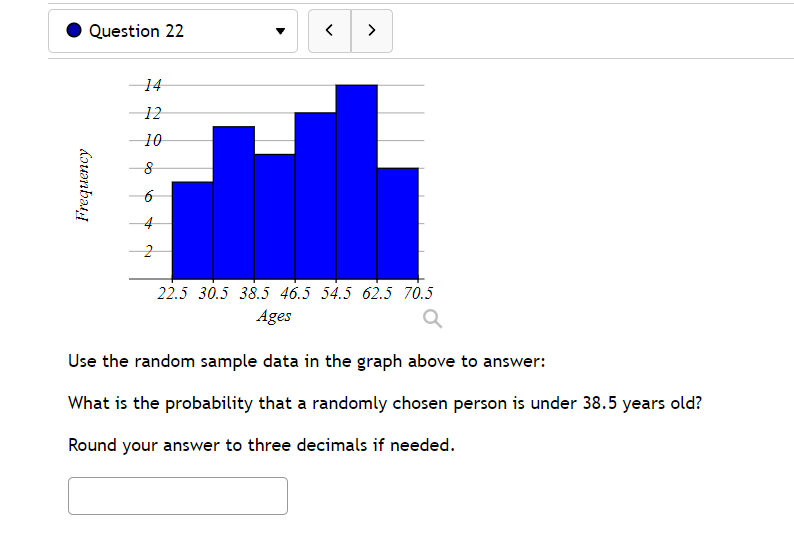
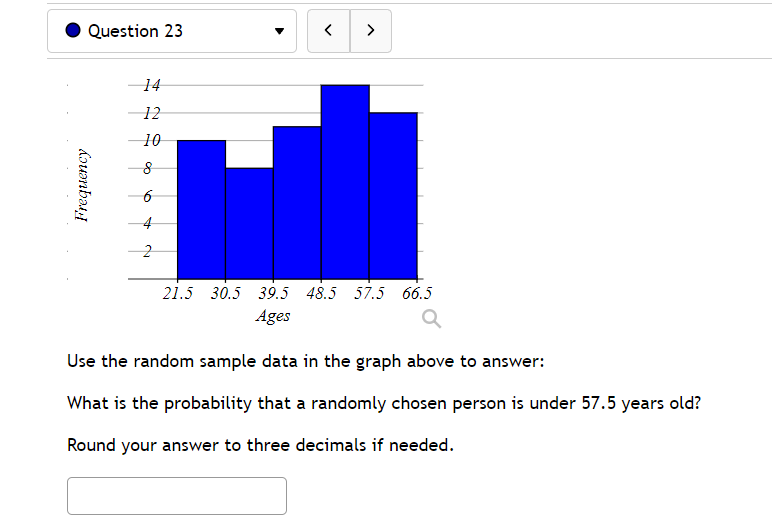
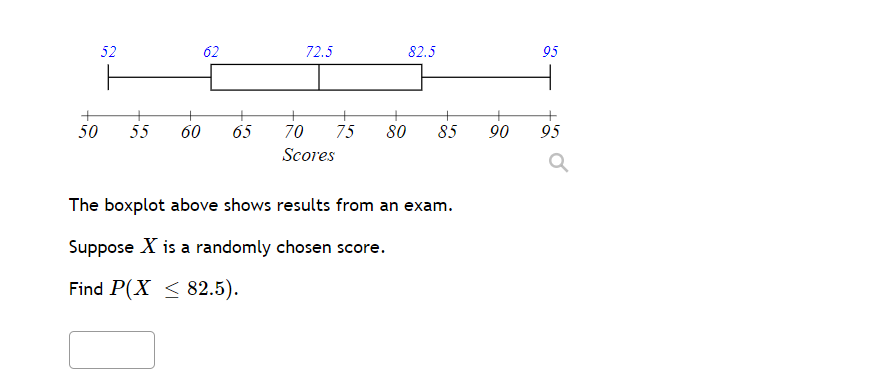


0 Question 22 v Frequency 22.5 30.5 38.5 45.5 54.5 62.5 70.5 Ages Q Use the random sample data in the graph above to answer: What is the probability that a randomly chosen person is under 38.5 years old? Round your answer to three decimals if needed. Question 23 14 12 10 Frequency NJ 21.5 30.5 39.5 48.5 57.5 66.5 Ages a Use the random sample data in the graph above to answer: What is the probability that a randomly chosen person is under 57.5 years old? Round your answer to three decimals if needed.95 52 62 72.5 82.5 + 95 50 55 60 65 70 75 80 85 90 Scores Q The boxplot above shows results from an exam. Suppose X is a randomly chosen score. Find P(X
Step by Step Solution
There are 3 Steps involved in it

Get step-by-step solutions from verified subject matter experts