

Question: 0 Use the given process data to construct a control chart for p Data was collected for the number of births per 10 000 people

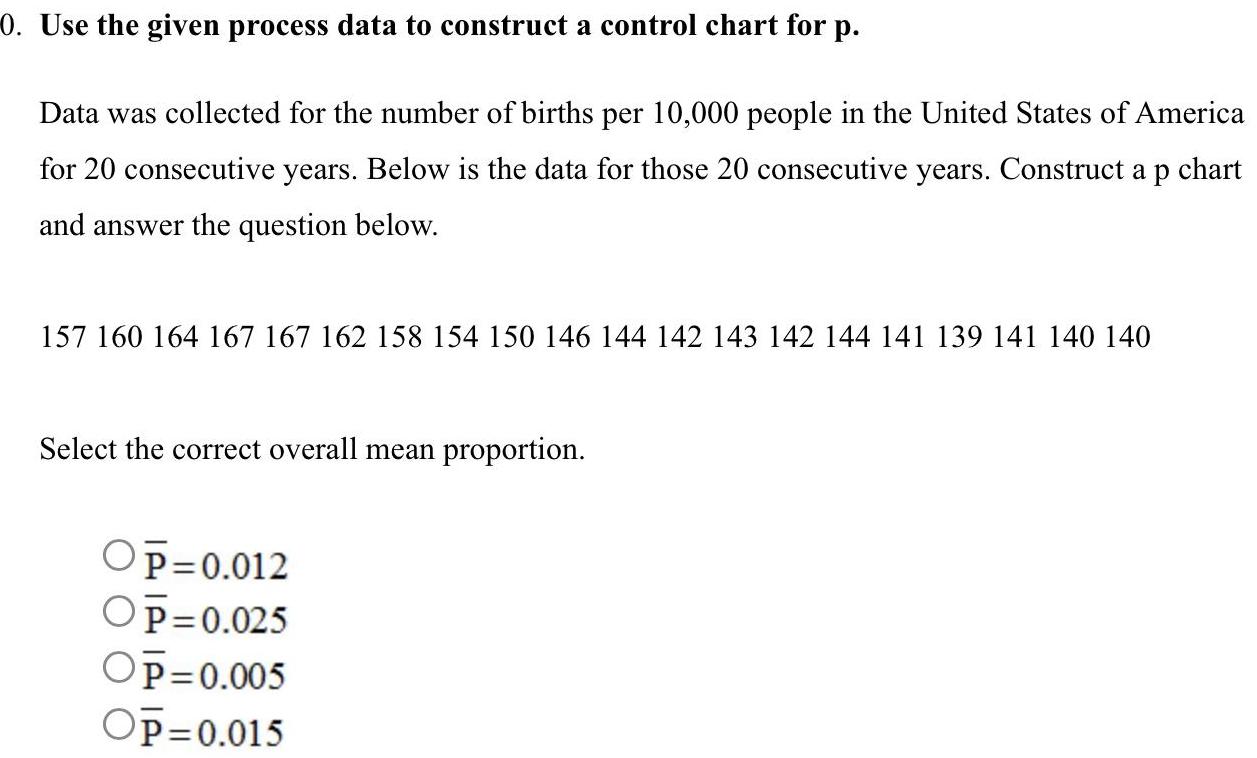
0 Use the given process data to construct a control chart for p Data was collected for the number of births per 10 000 people in the United States of America for 20 consecutive years Below is the data for those 20 consecutive years Construct a p chart and answer the question below 157 160 164 167 167 162 158 154 150 146 144 142 143 142 144 141 139 141 140 140 Select the correct overall mean proportion OP 0 012 OP 0 025 OP 0 005 OP 0 015
Step by Step Solution
There are 3 Steps involved in it
1 Expert Approved Answer
Step: 1 Unlock

Question Has Been Solved by an Expert!
Get step-by-step solutions from verified subject matter experts
Step: 2 Unlock
Step: 3 Unlock