

Question: 0. Using the factors in the above table, determine upper and lower limits for mean and range charts. (Do not round intermediate calculations. Round your
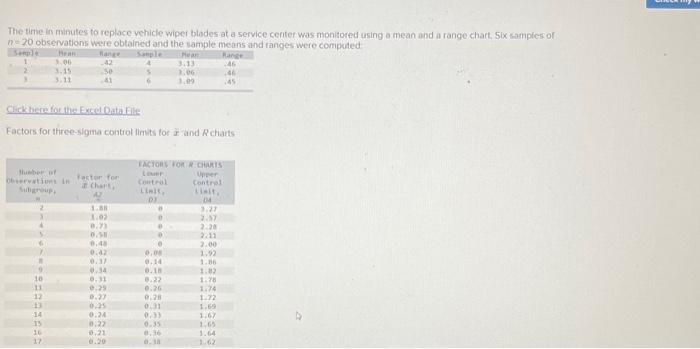
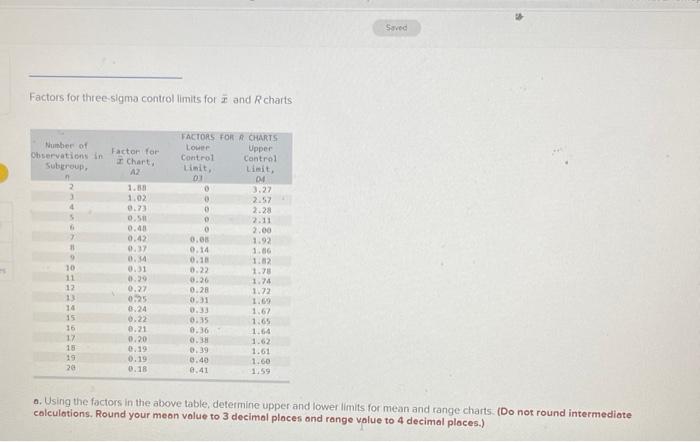
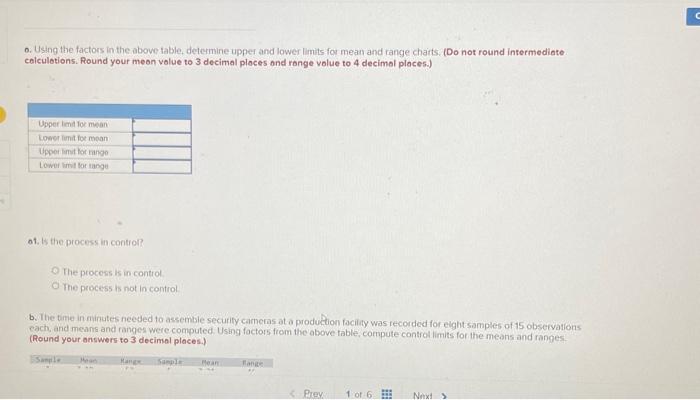
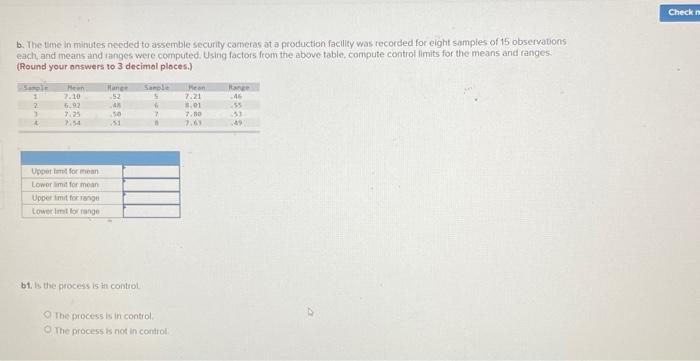
0. Using the factors in the above table, determine upper and lower limits for mean and range charts. (Do not round intermediate calculations. Round your mean volue to 3 decimal ploces and range volue to 4 decimol places.) of. Is the process in contror? The process is in control The process is not in control. b. The time in minutes needed to assemble securify camens at a produCtion facility was recorded for eight samples of 15 observations each, and means and ranges were computed. Using foctors from the above fable, cornpute control limits for the means and ranges. (Round your answers to 3 decimal places.) Factors for three-sigma control limits for x and R charts 0. Using the factors in the above table, determine upper and lower limits for mean and range charts. (Do not round intermediate colculations. Round your mean value to 3 decimal places and range value to 4 decimal places.) The time in minutes to replace vehicle wiper blodes at a service center was monitored using a mean and a range chart, Six samples of n=20 observations were obtained and the eamnie menase and ranges were compoted. Clickhera foe the Excel Datafile Factors for threesigme eontrol Himits for ix and R chaits b. The time in minutes needed to assemble security cameras at a production facility was recorded for eight samples of 15 observations each, and means ind ranges were computed. Using factors from the above table, compute controf limits for the means and ranges: (Round your onswers to 3 decimal ploces.) b1. Is the process is in control The proces 5 is in control. The process is not in control
Step by Step Solution
There are 3 Steps involved in it

Get step-by-step solutions from verified subject matter experts