

Question: 0. We discussed the following graph in class last week. It is from Robert Shiller's Nobel Prize presentation. It is an updated version of figure
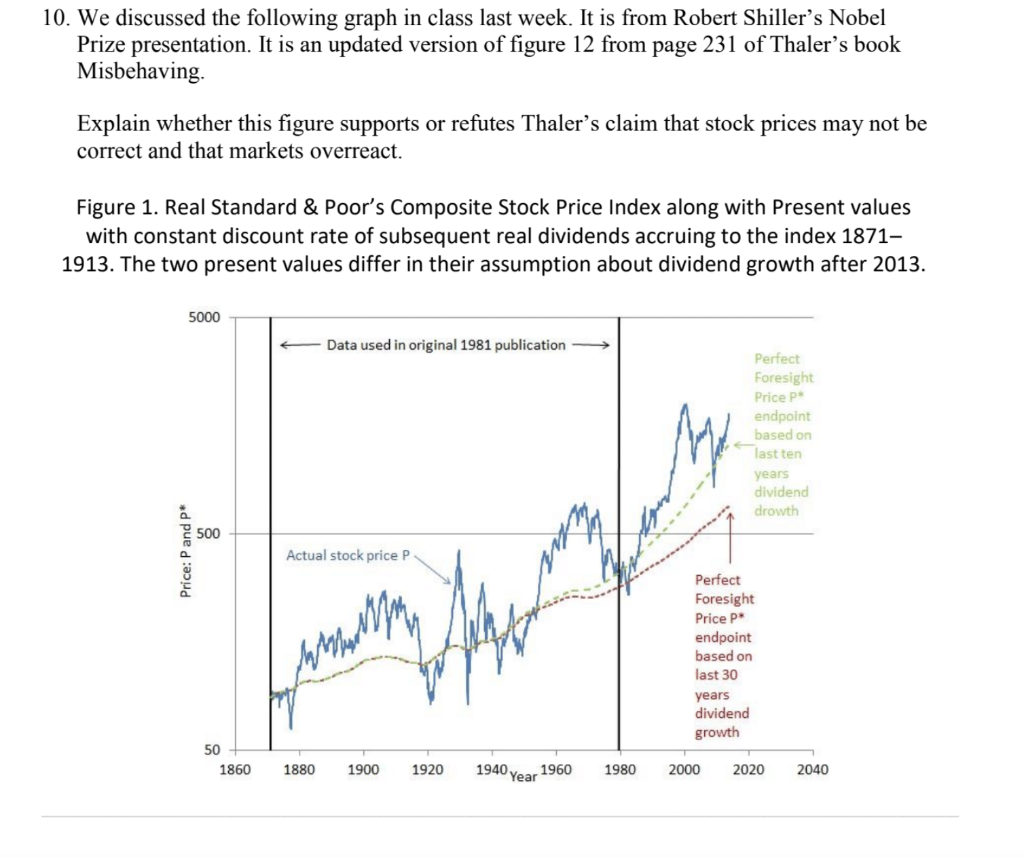
0. We discussed the following graph in class last week. It is from Robert Shiller's Nobel Prize presentation. It is an updated version of figure 12 from page 231 of Thaler's book Misbehaving. Explain whether this figure supports or refutes Thaler's claim that stock prices may not be correct and that markets overreact. Figure 1. Real Standard \& Poor's Composite Stock Price Index along with Present values with constant discount rate of subsequent real dividends accruing to the index 18711913. The two present values differ in their assumption about dividend growth after 2013. 0. We discussed the following graph in class last week. It is from Robert Shiller's Nobel Prize presentation. It is an updated version of figure 12 from page 231 of Thaler's book Misbehaving. Explain whether this figure supports or refutes Thaler's claim that stock prices may not be correct and that markets overreact. Figure 1. Real Standard \& Poor's Composite Stock Price Index along with Present values with constant discount rate of subsequent real dividends accruing to the index 18711913. The two present values differ in their assumption about dividend growth after 2013
Step by Step Solution
There are 3 Steps involved in it

Get step-by-step solutions from verified subject matter experts