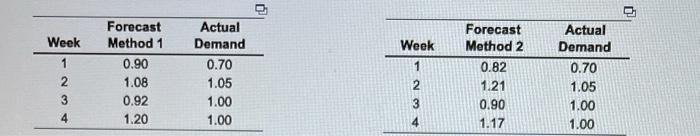
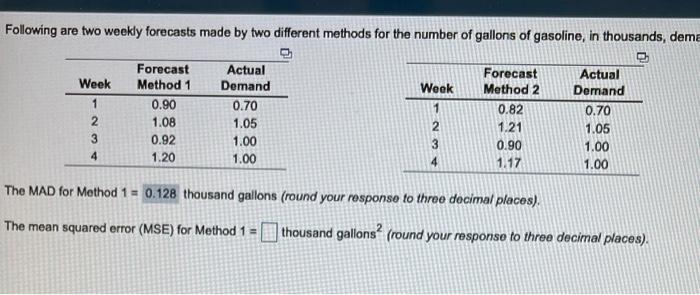
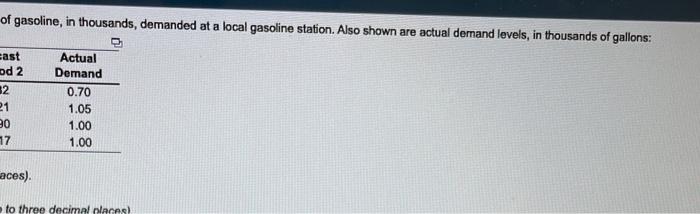
Question: 0 Week 1 2 3 4 Forecast Method 1 0.90 1.08 0.92 1.20 Actual Demand 0.70 1.05 1.00 1.00 Week 1 2 3 Forecast Method

0 Week 1 2 3 4 Forecast Method 1 0.90 1.08 0.92
0 Week 1 2 3 4 Forecast Method 1 0.90 1.08 0.92 1.20 Actual Demand 0.70 1.05 1.00 1.00 Week 1 2 3 Forecast Method 2 0.82 1.21 0.90 1.17 Actual Demand 0.70 1.05 1.00 1.00 Following are two weekly forecasts made by two different methods for the number of gallons of gasoline, in thousands, deme Week 1 Forecast Method 1 0.90 1.08 0.92 1.20 Week 1 Actual Demand 0.70 1.05 1.00 1.00 Forecast Method 2 0.82 1.21 0.90 1.17 2 3 4 Actual Demand 0.70 1.05 1.00 1.00 2 4 The MAD for Method 1 = 0.128 thousand gallons (round your response to three decimal places) The mean squared error (MSE) for Method 1 = thousand gallons? (round your response to three decimal places). of gasoline, in thousands, demanded at a local gasoline station. Also shown are actual demand levels, in thousands of gallons: East od 2 12 21 20 17 Actual Demand 0.70 1.05 1.00 1.00 aces) to three decimal places)

Step by Step Solution

There are 3 Steps involved in it

1 Expert Approved Answer
Step: 1 Unlock blur-text-image
Question Has Been Solved by an Expert!

Get step-by-step solutions from verified subject matter experts

Step: 2 Unlock
Step: 3 Unlock

Students Have Also Explored These Related General Management Questions!