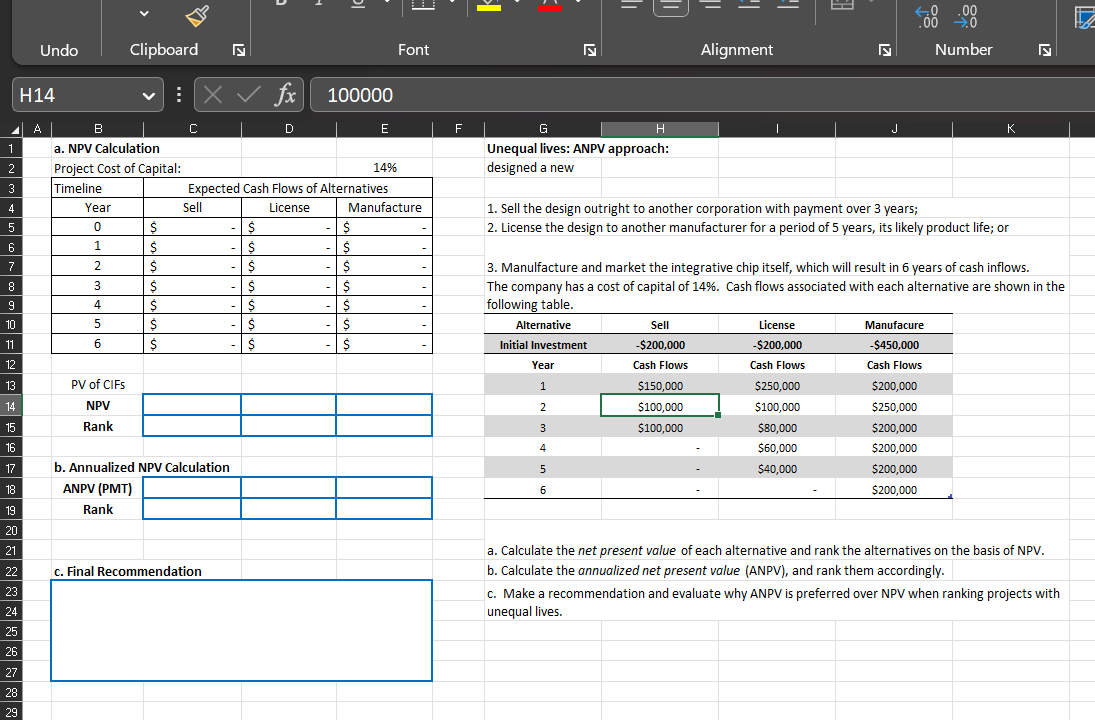
Question: .00 -0 Undo Clipboard Font Alignment Number H14 X V fx 100000 A B C D E F G H K a. NPV Calculation Unequal
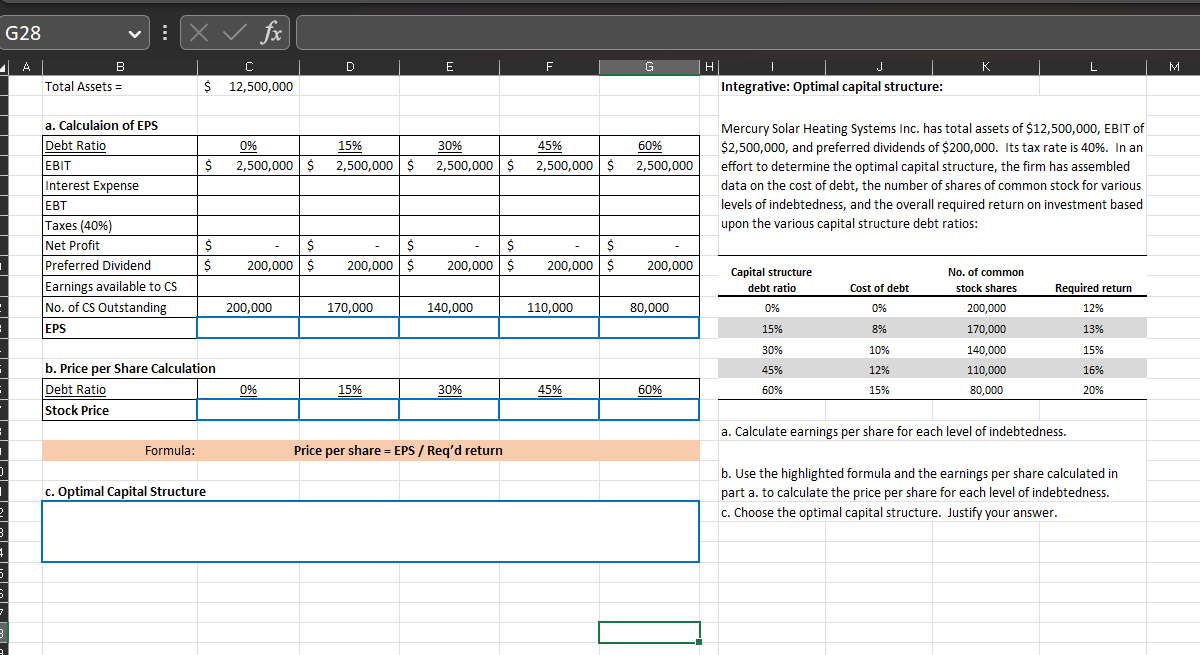
.00 -0 Undo Clipboard Font Alignment Number H14 X V fx 100000 A B C D E F G H K a. NPV Calculation Unequal lives: ANPV approach: 2 Project Cost of Capital: 14% designed a new 3 Timeline Expected Cash Flows of Alternatives Year Sel License Manufacture 1. Sell the design outright to another corporation with payment over 3 years; 0 $ - IS 2. License the design to another manufacturer for a period of 5 years, its likely product life; or 1 S S 2 S 3. Manulfacture and market the integrative chip itself, which will result in 6 years of cash inflows. 8 3 S S S The company has a cost of capital of 14%. Cash flows associated with each alternative are shown in the 4 following table 5 S S Alternative Sell License Manufacure - $ Initial Investment -$200,000 -$200,000 $450,000 12 Year Cash Flows Cash Flows Cash Flows 13 PV of CIFS 1 $150,000 $250,000 $200,000 14 NPV 2 $100,000 $100,000 $250,000 15 Rank 3 $100,000 $80,000 $200,000 16 4 $60,000 $200,000 17 b. Annualized NPV Calculation 5 $40,000 $200,000 18 ANPV (PMT) 6 $200,000 19 Rank 20 21 a. Calculate the net present value of each alternative and rank the alternatives on the basis of NPV. 22 c. Final Recommendation b. Calculate the annualized net present value (ANPV), and rank them accordingly. 23 c. Make a recommendation and evaluate why ANPV is preferred over NPV when ranking projects with 24 unequal lives. 25 26 27 28 29Total Assets = S Integrative: Optimal capital structure: 3- Calculaion 0' EP5 MercurvErolar Heating Systems Inc. has total assets of S12,500,000, EBIT of Debt Ratio % M w M S2,500,000, and preferred dividends of S200,000. Itstax rate is 21.0%. In an EBIT 2,500,000 S 2,500,000 S 2,500,000 S 2,500,000 S 2,500,000 effort to determine the optimal capital structure, the firm has assembled Interest Expense data on the cost of debt, the number of shares of common stock for various EBT levels of indebtedness, and the overall required return on investment based Taxes [40%] upon the various capital structure debt ratios: Net Profit S S S - S - S Preferred DIVIdend S 200,000 S 200,000 S 200,000 S 200,000 S 200,000 capital \"mm\"? No.0tmmmon Earnings available to CS debt ratio Cost at debt stock shares Required return No. of [35 Outstanding 200,000 170,000 140,000 110,000 80,000 0% 0% 200,000 1296 EPS 1.59:. 3% 170,000 139:. 30% 10% 140,\" 15% 0. Price per sha re Calculation 459a 12% 110,000 15% Debt Ratio g m m m m 50% 15% 30,010 20% Formula: c. Optimal Capital Structure Price per sha re = EPS,l Req'd return Stock Price a. Calculate earnings per share for each level of indebtedness. b. Use the highlighted formula and the earnings per share calculated in part a. to calculate the price per share for each level of indebtedness. c. Choose the optimal capital structure. Justify your
Step by Step Solution
There are 3 Steps involved in it
1 Expert Approved Answer
Step: 1 Unlock
Question Has Been Solved by an Expert!
Get step-by-step solutions from verified subject matter experts
Step: 2 Unlock
Step: 3 Unlock
Students Have Also Explored These Related Finance Questions!