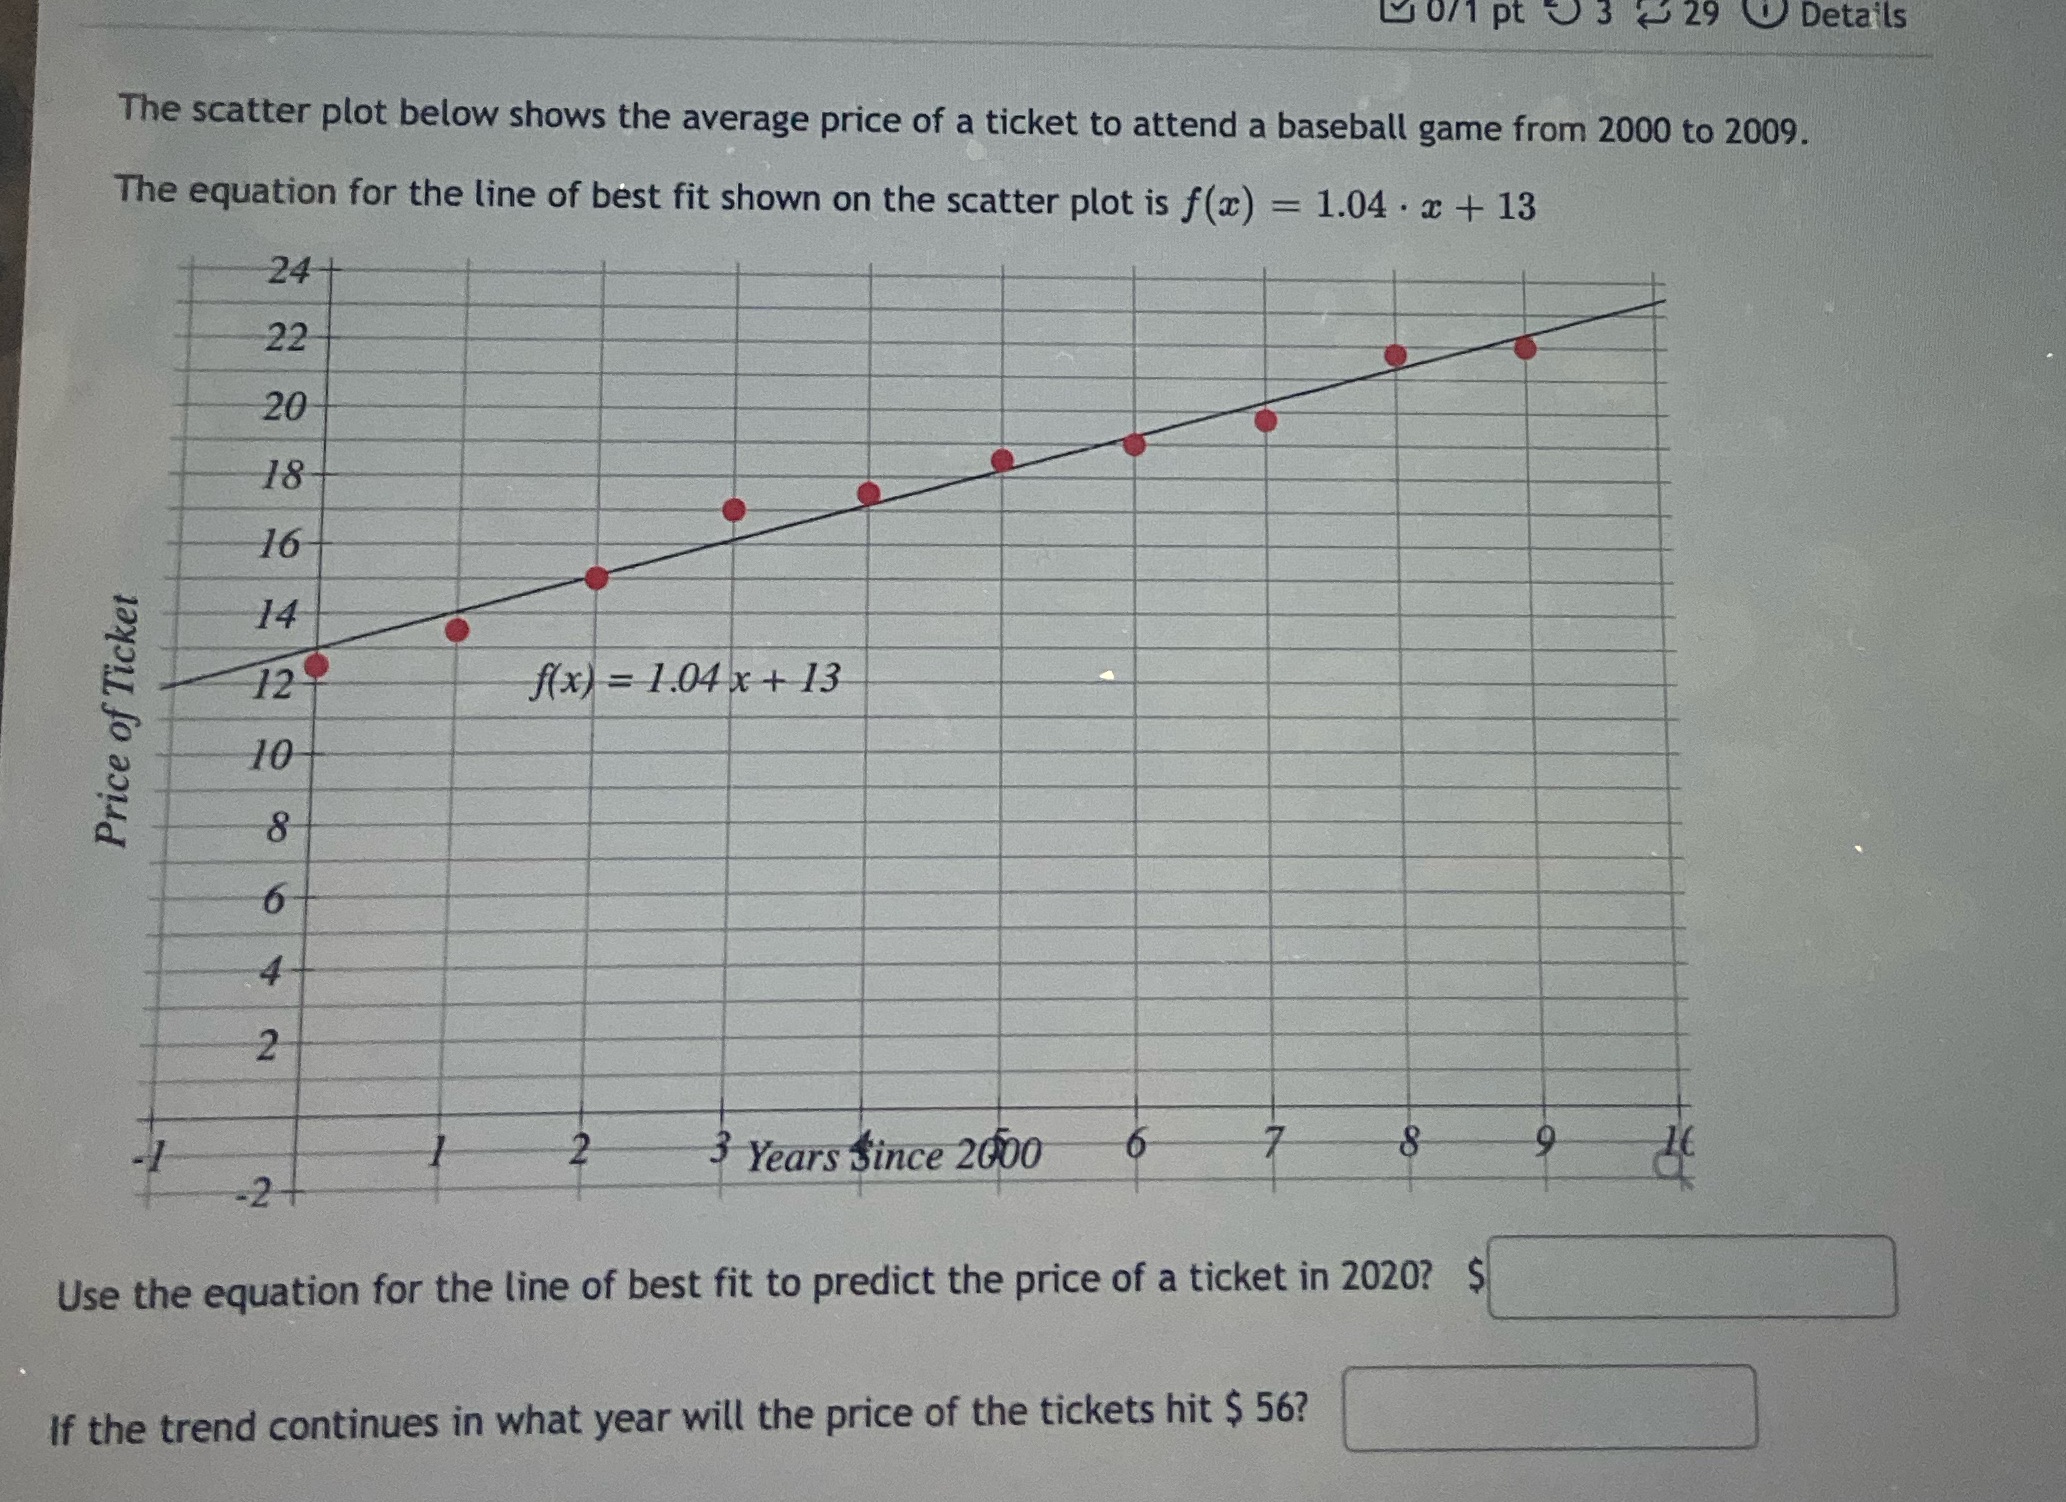
Question: 0/1 pt J 3 29 Details The scatter plot below shows the average price of a ticket to attend a baseball game from 2000 to

0/1 pt J 3 29 Details The scatter plot below
0/1 pt J 3 29 Details The scatter plot below shows the average price of a ticket to attend a baseball game from 2000 to 2009. The equation for the line of best fit shown on the scatter plot is f(x) = 1.04 . x + 13 24 22 20 18 16 14 12 f(x) = 1.04 x + 13 Price of Ticket 10 8 6 2 3 Years since 2600 6 Co 19 Use the equation for the line of best fit to predict the price of a ticket in 2020? $ If the trend continues in what year will the price of the tickets hit $ 56

Step by Step Solution

There are 3 Steps involved in it

1 Expert Approved Answer
Step: 1 Unlock blur-text-image
Question Has Been Solved by an Expert!

Get step-by-step solutions from verified subject matter experts

Step: 2 Unlock
Step: 3 Unlock

Students Have Also Explored These Related Mathematics Questions!