

Question: 019 Problem 2: Given the following Time Chart and Network Diagram, find the Critical Path. mb 4t 3 Activity A B C D a 21
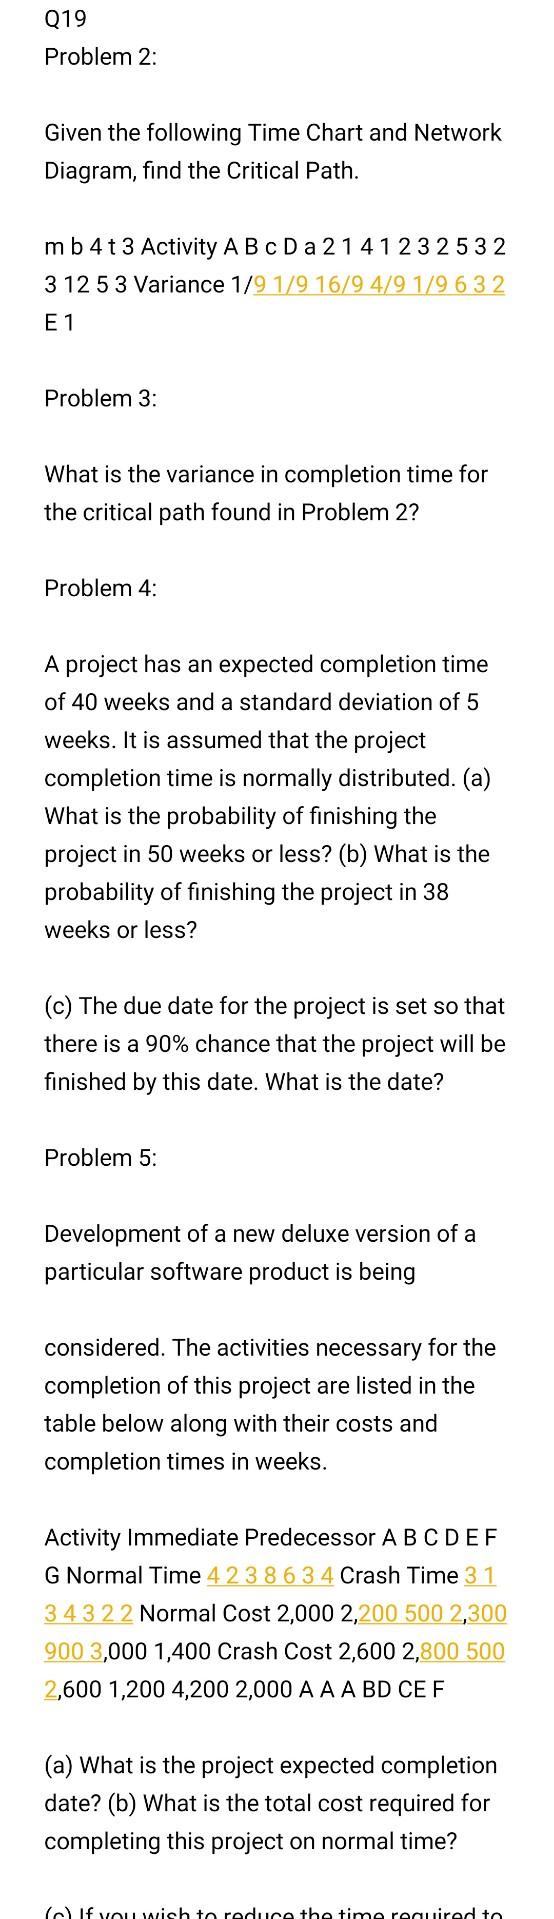
019 Problem 2: Given the following Time Chart and Network Diagram, find the Critical Path. mb 4t 3 Activity A B C D a 21 41232532 3 1253 Variance 1/91/916/94/91/9632 E 1 Problem 3: What is the variance in completion time for the critical path found in Problem 2? Problem 4: A project has an expected completion time of 40 weeks and a standard deviation of 5 weeks. It is assumed that the project completion time is normally distributed. (a) What is the probability of finishing the project in 50 weeks or less? (b) What is the probability of finishing the project in 38 weeks or less? (c) The due date for the project is set so that there is a 90% chance that the project will be finished by this date. What is the date? Problem 5: Development of a new deluxe version of a particular software product is being considered. The activities necessary for the completion of this project are listed in the table below along with their costs and completion times in weeks. Activity Immediate Predecessor ABCDEF G Normal Time 423 8 6 3 4 Crash Time 31 3432 2 Normal Cost 2,000 2,200 500 2,300 900 3,000 1,400 Crash Cost 2,600 2,800 500 2,600 1,200 4,200 2,000 A A ABD CEF (a) What is the project expected completion date? (b) What is the total cost required for completing this project on normal time? If you wish to reduce the time required to
Step by Step Solution
There are 3 Steps involved in it
1 Expert Approved Answer
Step: 1 Unlock

Question Has Been Solved by an Expert!
Get step-by-step solutions from verified subject matter experts
Step: 2 Unlock
Step: 3 Unlock