

Question: 0.2 8.0 1.2 Long-term debt ratio Times interest earned Current ratio Quick ratio Cash ratio Inventory turnover Average collection 0.2 3.0 73 days Use the
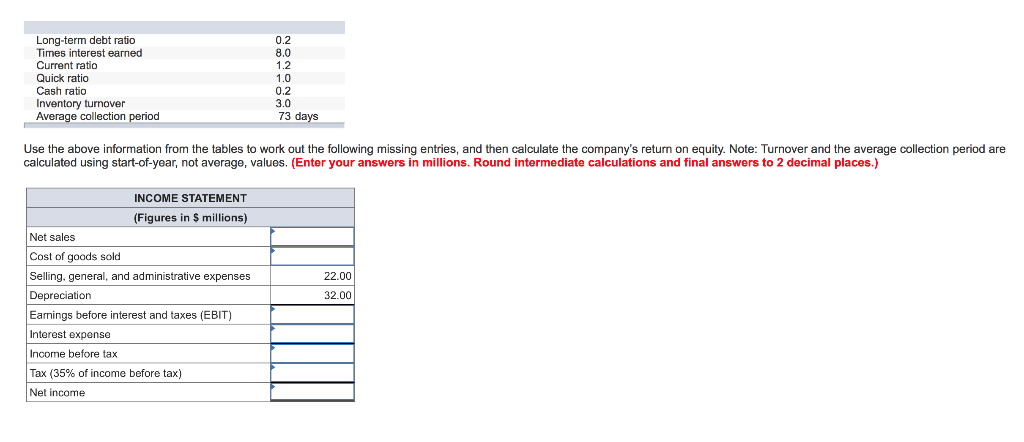
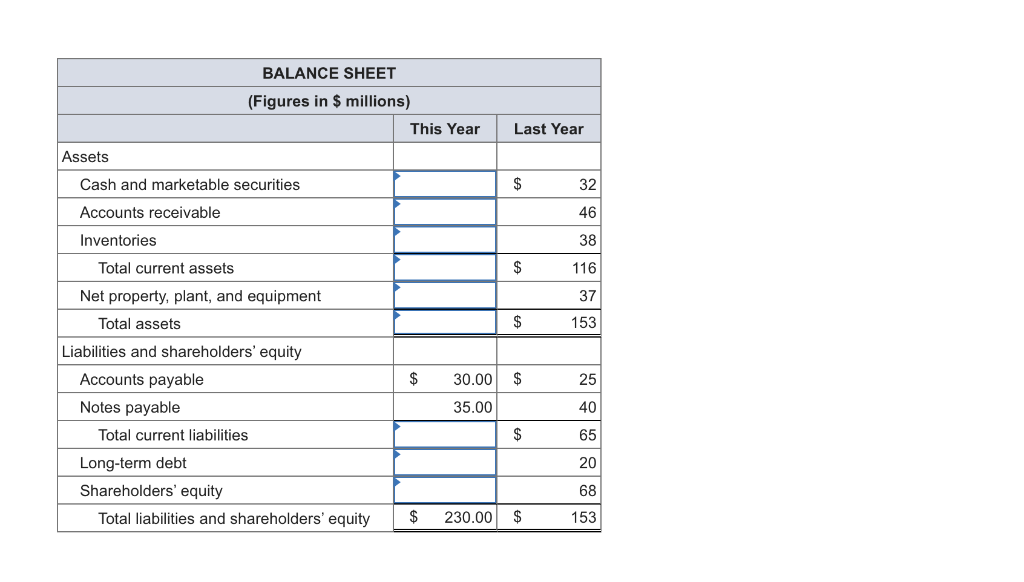
0.2 8.0 1.2 Long-term debt ratio Times interest earned Current ratio Quick ratio Cash ratio Inventory turnover Average collection 0.2 3.0 73 days Use the above information from the tables to work out the following missing entries, and then calculate the company's return on equity. Note: Turnover and the average collection period are calculated using start-of-year, not average, values. (Enter your answers in millions. Round intermediate calculations and final answers to 2 decimal places.) INCOME STATEMENT (Figures in $ millions) Net sales Cost of goods sold Selling. general, and administrative expenses Depreciation Eamings before interest and taxes (EBIT) Interest expense Income before tax Tax (35% of income before tax) Net income 22.00 32.00 BALANCE SHEET (Figures in $ millions) This Year Last Year Assets Cash and marketable securities Accounts receivable Inventories 32 46 38 116 37 153 Total current assets Net property, plant, and equipment Total assets Liabilities and shareholders' equity $30.00 $ 35.00 Accounts payable Notes payable 25 40 65 20 68 153 Total current liabilities Long-term debt Shareholders' equity Total liabilities and shareholders' equity $ 230.00 S 0.2 8.0 1.2 Long-term debt ratio Times interest earned Current ratio Quick ratio Cash ratio Inventory turnover Average collection 0.2 3.0 73 days Use the above information from the tables to work out the following missing entries, and then calculate the company's return on equity. Note: Turnover and the average collection period are calculated using start-of-year, not average, values. (Enter your answers in millions. Round intermediate calculations and final answers to 2 decimal places.) INCOME STATEMENT (Figures in $ millions) Net sales Cost of goods sold Selling. general, and administrative expenses Depreciation Eamings before interest and taxes (EBIT) Interest expense Income before tax Tax (35% of income before tax) Net income 22.00 32.00 BALANCE SHEET (Figures in $ millions) This Year Last Year Assets Cash and marketable securities Accounts receivable Inventories 32 46 38 116 37 153 Total current assets Net property, plant, and equipment Total assets Liabilities and shareholders' equity $30.00 $ 35.00 Accounts payable Notes payable 25 40 65 20 68 153 Total current liabilities Long-term debt Shareholders' equity Total liabilities and shareholders' equity $ 230.00 S
Step by Step Solution
There are 3 Steps involved in it

Get step-by-step solutions from verified subject matter experts