

Question: 0.2. Creating Histograms This experiment generates N=100,000 random numbers. The results of the experiment are plotted in a histogram, using the MATLAB hist function. Depending
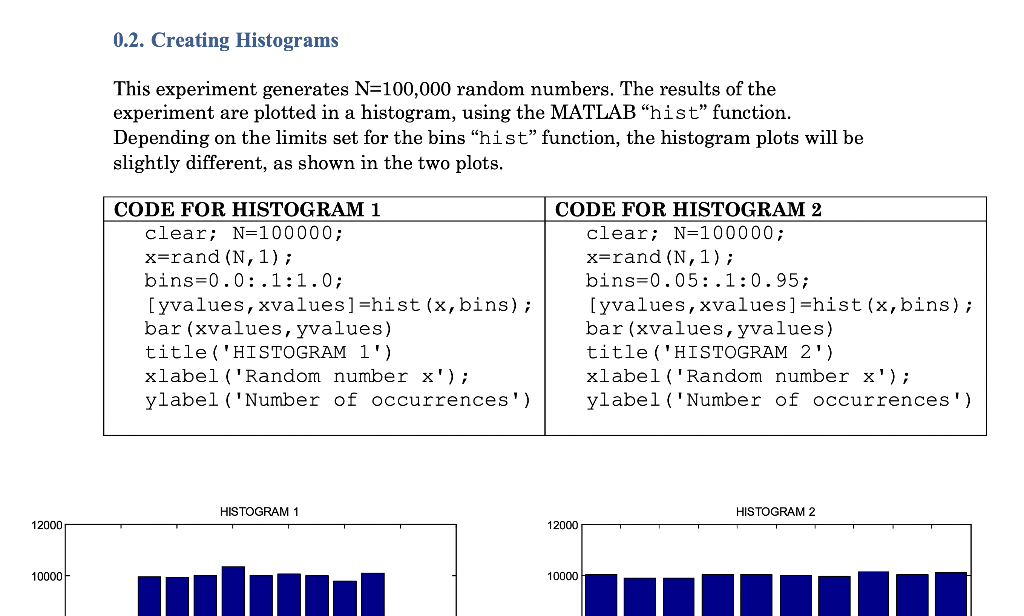
0.2. Creating Histograms This experiment generates N=100,000 random numbers. The results of the experiment are plotted in a histogram, using the MATLAB hist function. Depending on the limits set for the bins "hist function, the histogram plots will be slightly different, as shown in the two plots. CODE FOR HISTOGRAM 1 clear; N=100000; x=rand (N, 1); bins=0.0:.1:1.0; [yvalues, xvalues] =hist(x,bins); bar (xvalues, yvalues) title('HISTOGRAM 1') xlabel('Random number x'); ylabel ('Number of occurrences') CODE FOR HISTOGRAM 2 clear; N=100000; x=rand (N, 1); bins=0.05:.1:0.95; [yvalues, xvalues] =hist(x, bins); bar(xvalues, yvalues) title('HISTOGRAM 2') xlabel('Random number x'); ylabel ('Number of occurrences') HISTOGRAM 1 HISTOGRAM 2 12000 12000 10000 10000
Step by Step Solution
There are 3 Steps involved in it

Get step-by-step solutions from verified subject matter experts