

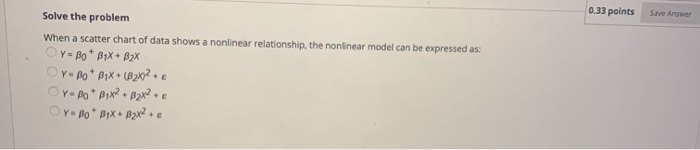
Question: 0.33 points Save Answer Solve the problem When a scatter chart of data shows a nonlinear relationship, the nonlinear model can be expressed as: Y
Step by Step Solution
There are 3 Steps involved in it
1 Expert Approved Answer
Step: 1 Unlock

Question Has Been Solved by an Expert!
Get step-by-step solutions from verified subject matter experts
Step: 2 Unlock
Step: 3 Unlock