

Question: 08- Assignment-Risk and Rates of Return Remember, the expected value of a probability distribution is a statistical measure of the average (mear) value expected to
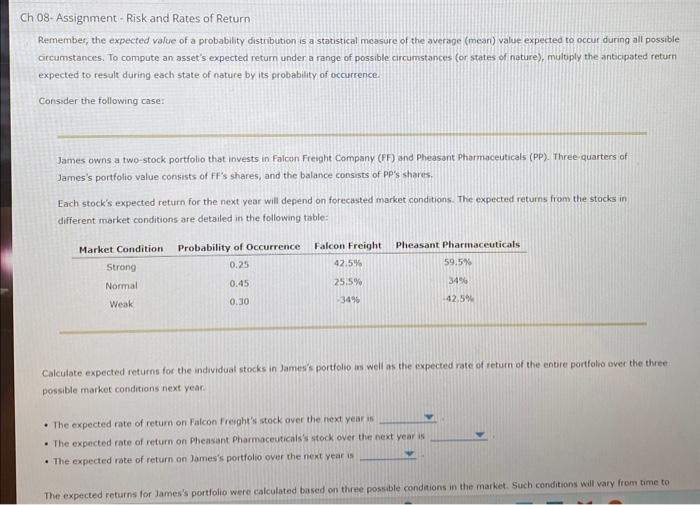
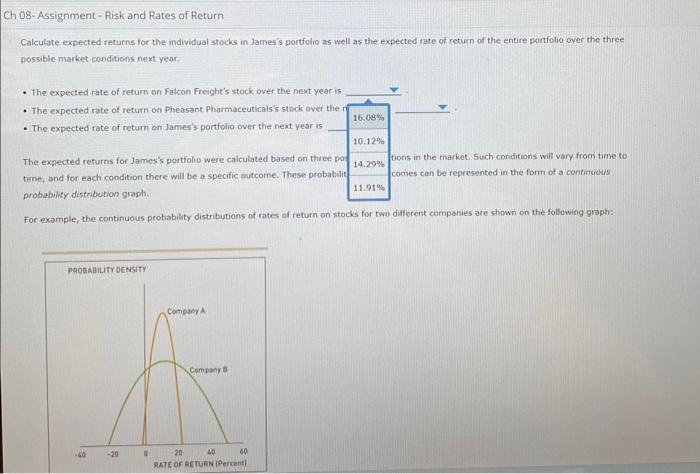
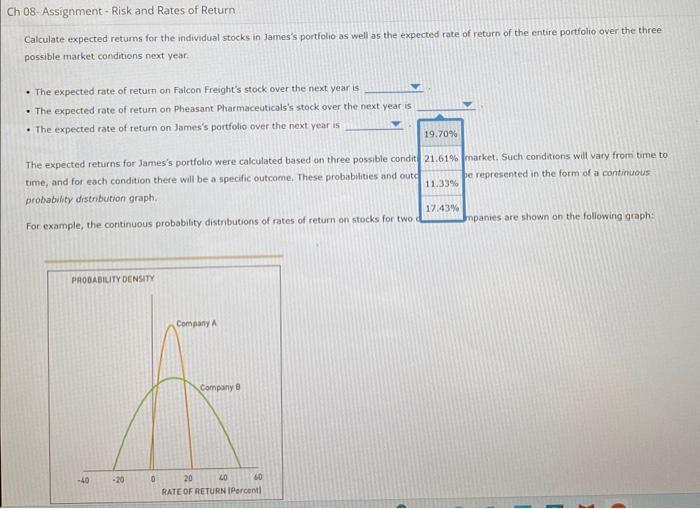
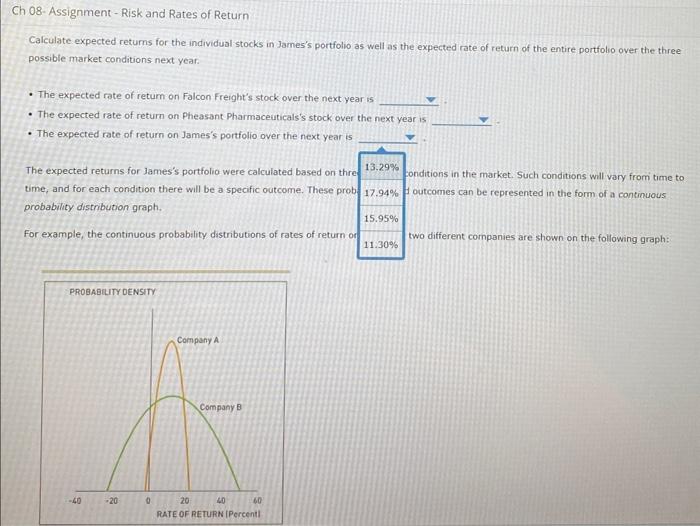
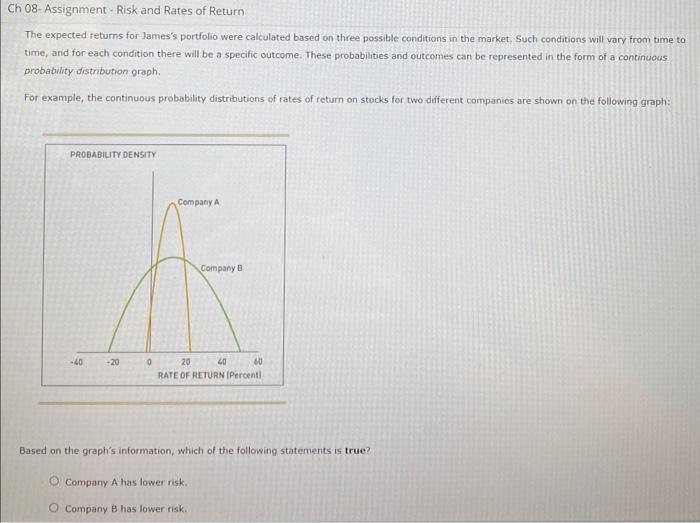
08- Assignment-Risk and Rates of Return Remember, the expected value of a probability distribution is a statistical measure of the average (mear) value expected to occur during all possible circumstances. To compute an asset's expected return under a range of possible circumstances (or states of nature), multuply the anticpated return expected to result during each state of nature by its probability of occurrence. Consider the following case: James owns a two-stock portfolio that invests in Falcon Fieight Compsny (FF) and Pheasant Pharmaceuticals (PP). Three-quarters of James's portfolio value consists of FF 's shares, and the balance consists of PP's shares. Each stock's expected return for the next year will depend on forecasted market conditions. The expected returns from the stocks in different market conditions are detailed in the following table: Calculate expected returns for the individual stocks in lames's portfolio is well as the expected rate of return of the entire portfolio over the three possible market conditions next year: - The expected rate of retum on Faicon freght's stock over the next year is - The expected rate of return on Pheasant Pharmaceuticals's stock over the next year is - The expected rate of return on James's portfolio over the next year is The expected returns for lames's portfolio were calculated based on three possble conditions in the market. Such conditions will vary from time to Calculate expected rerurns for the individual stocks in-James's portfolio as well as the expected rate of return of the entire portfolio over the three possible market conditions next year. - The expected rate of return on Falcon Freight's stock over the next yearis - The expected rate of return on Pheasant Pharmaceuticals's stock over the i - The expected rate of return on James's portfolio over the next year is The expected returns for Jamos's portfolio were calculated based on three po tions in the market. Such conditions will vary from time to time, and for each condition there will be a specific outcome. These probabilit probabuity distribution graph. For example, the continuous probability distributions of rates of return on stocks for two different companies are shown on the following graph: Calculate expected returns for the individual stocks in James's portfolio as well as the expected rate of return of the entire portfolio over the three. possible market conditions next year. - The expected rate of return on Falcon Fresght's stock over the next year is - The expected rate of return on. Pheasant. Pharmaceuticals's stock over the next year is - The expected rate of return on James's portfolio over the next year is The expected returns for James's portfolio were calculated based on three possible condit 21.61\% market. Such conditions will vary from time to. time, and for each condition there will be a specific outcome. These probabilities and outc 11.33% probabily distribution graph. 17.43% For example, the conitinuous probabilaty distributions of rates of return on stocks for two mpanies are shown on the following graph: Calculate expected returns for the individual stocks in James's portfolio as well as the expected rate of return of the entire portfolio over the three possible market conditions next year: - The expected rate of return on Falcon Freight's stock over the next year is - The expected rate of return on Pheasant Pharmaceuticals's stock over the next year is - The expected rate of return on James's portfolio over the next year is The expected returns for James's portfolio were calculated based on thre 13.29% conditions in the market. Such conditions will vary from time to time, and for each condition there will be a specific outcome. These prob- 17.94%1 outcomes can be represented in the form of a continuous probabulity distribution graph. For example, the continuous probability distributions of rates of return or 11.30% The expected returns for James's portfolio were calculated bosed on three possible conditions in the market. Such conditions will vary from time to time, and for each condition there will be a specific outcome. These probabilities and outcomes can be represented in the form of a cantinuous probability distribution graph. For example, the continuous probability distributions of rates of return on stocks for two different companies are shown on the following graph: Based on the graph's information, which of the following statements is true? Company A has lower risk. Company B has lower risk
Step by Step Solution
There are 3 Steps involved in it

Get step-by-step solutions from verified subject matter experts