

Question: 09. Summary (detailed analysis is required) 9-1. List your overall conclusion on the financial analysis. 9-2. Were the financial ratios and indicators accurate reflection of
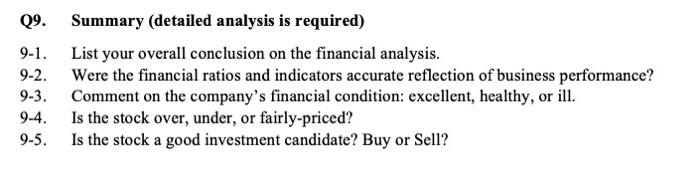
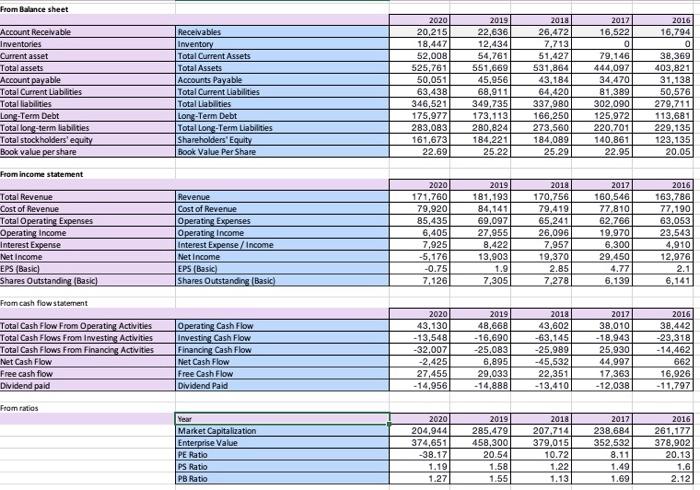
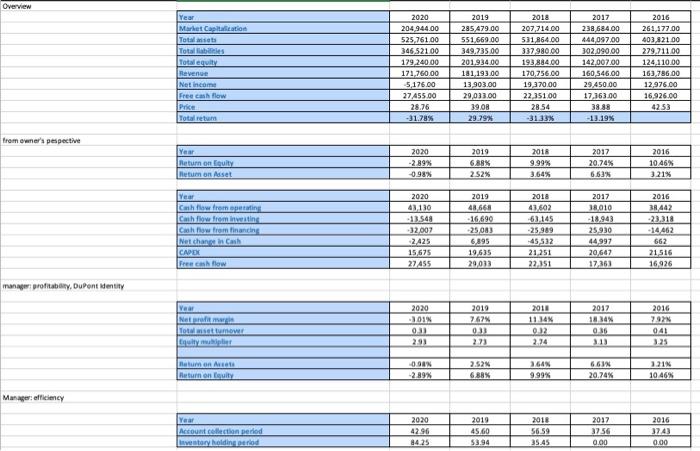
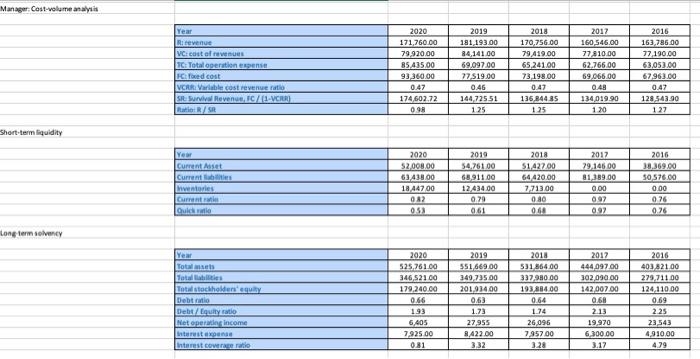
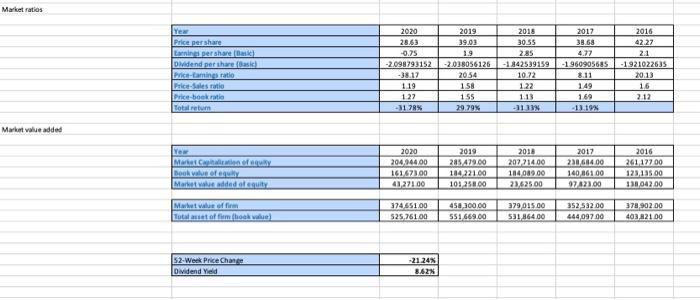
09. Summary (detailed analysis is required) 9-1. List your overall conclusion on the financial analysis. 9-2. Were the financial ratios and indicators accurate reflection of business performance? 9-3. Comment on the company's financial condition: excellent, healthy, or ill. 9-4. Is the stock over, under, or fairly-priced? 9-5. Is the stock a good investment candidate? Buy or Sell? From Balance sheet Account Receivable Inventories Current asset Total assets Account payable Total Current Liabilities Total liabilities Long-Term Debt Total long-term liabilities Total stockholders' equity Book value pershare Receivables Inventory Total Current Assets Total Assets Accounts Payable Total Current Liabilities Total Liabilities Long-Term Debt Total Long-Term Liabilities Shareholders' Equity Book Value Per Share 2020 20,215 18,447 52,008 525,761 50.051 63,438 346,521 175,977 283,083 161,673 22.69 2019 22,636 12,434 54,761 551,669 45,956 68,911 349,735 173,113 280,824 184,221 25.22 2018 26,472 7.713 51,427 531,864 43,184 64,420 337,980 166.250 273,560 184,089 25.29 2017 16,522 0 79.146 444,097 34.470 81.389 302.090 125.972 220.701 140.861 22.95 2016 16,794 0 38,369 403,821 31,138 50,576 279,711 113,681 229.135 123.135 20.05 From income statement Total Revenue Cost of Revenue Total Operating Expenses Operating Income Interest Expense Net Income EPS (Basic) Shares Outstanding Basic) Revenue Cost of Revenue Operating Expenses Operating Income Interest Expense/Income Net Income EPS (Basic) Shares Outstanding (Basic) 2020 171,760 79,920 85,435 6.405 7.925 -5,176 -0.75 7,126 2019 181,193 84,141 69,097 27,955 8.422 13.903 1.9 7,305 2018 170.756 79.419 65.241 26,096 7,957 19,370 2.85 7.278 2017 160 546 77.810 62.766 19.970 6.300 29.450 4.77 6.139 2016 163,786 77,190 63,053 23,543 4,910 12,976 2.1 6,141 From cash flow statement Total Cash Flow From Operating Activities Total Cash Flows From Investing Activities Total Cash Flows From Financing Activities Net Cash Flow Free cash flow Dividend paid Operating Cash Flow Investing Cash Flow Financing Cash Flow Net Cash Flow Free Cash Flow Dividend Paid 2020 43.130 -13,548 -32,007 -2.425 27,455 -14,956 2019 48.668 - 16,690 -25.083 6,895 29,033 -14,888 2018 43,602 -63.145 -25.989 -45,532 22,351 -13.410 2017 38.010 -18.943 25,930 44.997 17.363 -12.038 2016 38,442 -23,318 - 14,462 662 16.926 -11.797 From ratios Year Market Capitalization Enterprise Value PE Ratio PS Ratio PB Ratio 2020 204,944 374,651 -38.17 1.19 1.27 2019 285,479 458,300 20.54 1.58 1.55 2018 207,714 379,015 10.72 1.22 1.13 2017 238.684 352.532 8.11 1.49 1.69 2016 261.177 378,902 20.13 1.6 2.12 Overview Year Market Capitation Totalsts Total Total city Revenue Net Income Free cash flow Price Total retur 2020 204,944.00 525,761.00 346,52100 179,240.00 171,760.00 5,175.00 27 A55.00 28.76 -31.28% 2019 285 479.00 551,669.00 349.735.00 201.934 00 181,193.00 13.903.00 29013.00 39.08 29.79% 2018 207,714.00 531 864.00 337.980.00 193 884.00 170.756.00 19 270.00 22,35100 2854 -311 2017 238 684.00 444097.00 302.090.00 14200200 160,546,00 29,450.00 17,363.00 38.88 -13.19% 2016 261, 177.00 403.821 00 279.711.00 124.110.00 163,786.00 12,976.00 16,926.00 4253 from owner's pespective 2017 Year Return on Equity Return on Asset 2020 -2.89% -0.98% 2019 6.88% 2.52% 2018 9.99% 3.64% 20.74% 663N 2016 10 46% 321% 2019 2017 Year Cashflow from Cash flow from investing Ciohow from financing Net change in Cash CADEC Free cash flow 2020 43110 13.548 -32,007 2.425 15675 27455 48 668 -16,690 -25083 6895 19635 29033 2018 43602 63.165 -25,989 -45 S12 21 251 22.151 38010 -18.943 25.930 44 997 20647 17,368 2016 38442 -23,318 -14462 662 21 516 16,926 manager profitability, Dupont identity Year Nam Lottumor Equity mult 2020 B01N 033 2019 767 03 273 2010 11 JAN 012 2.34 2017 10 NON 0.36 2016 79N 041 291 66IN Return on to Return on fuity 090N -2.89% 2.52 6.88% 364 9.99% 1215 10 46'N 20.74% Manager: efficiency Year Account collection red ventary Rodin 2020 42.96 4425 2019 45.60 5394 2018 56.59 2017 37.56 0.00 2016 3743 0.00 Manager: Cost-volume analysis Year Ricevenue VC: cost of revenues TC Total operatione pense Coed cost VCR Variable cost revenue SR Survival Revenue I/1.VCR) R/SR 2020 171,760.00 79920.00 85 435.00 93,360.00 0.47 174,602.72 098 2019 191 193.00 84,14100 69,097.00 77,519.00 0.46 144,72551 1.25 2018 170,756.00 79419.00 65 241.00 73198.00 0.47 136,84485 125 2017 160 546.00 77 $10.00 62.766.00 69.066.00 048 134,019.90 120 2016 163.786.00 77,190.00 63,05300 67.963.00 0.47 128.543 90 127 Short-term liquidity You Current Asset Current 2020 52,008,00 6343800 18 44700 DR2 0.53 2019 54.761.00 68.911.00 12.434.00 0.29 961 2018 5142700 64 420.00 7.71300 0.80 068 2017 29,145 00 81.389.00 0.00 097 0.92 2016 38,369.00 SO 576.00 0.00 076 0.26 Current Quick Long term solvency Year To Totales Total stockholdenequity Debt ratio Debt/Equity Net operating Income interest and Interest coverage ratio 2020 525.761.00 346,521 00 179.240.00 0.66 1.93 2019 551 669.00 349.735.00 201,934.00 0.63 1.73 27955 8422.00 3.32 2018 531 86400 337.980.00 193.884.00 0.64 1.74 26096 7,957 00 3.28 2017 444,097.00 302.090.00 142.007.00 0.68 2.13 19.970 6,300.00 3.17 2016 403821.00 279 711 00 124,110.00 0.69 2.25 23,543 4,910.00 4.79 6405 7,925.00 0.81 Market ratios Yew Price per share Laris per share Basic Dividend per the basic Price-aming ratio Prices Price-book ratio totum 2020 28,63 -0.75 -2.098793152 -38.17 119 1.22 -31 78% 2019 39.03 1.9 -2.038056126 2054 158 155 2017 38.68 4.77 -1960905685 2016 30.55 2.85 -1842539159 10.72 1.22 1.13 2016 42.27 2.1 -1921022635 20.13 16 712 1.49 169 11.19% 29 79% NELIE Market value added OD New Martin Book of Marit dedocuity 2020 204.944.00 161.673.00 41,27100 2019 285 419.00 184 221.00 10:250.00 2010 202 214.00 184089.00 23,62500 2017 230684.00 140 86100 97421.00 2016 261,17700 123,135 00 138042.00 Mb Value of fim total set of flimkie 374551.00 525,76100 458,300.00 551569.00 379 15.00 531 86400 352 522.00 44409700 378 902.00 403.821.00 52-Week Price Chance Dividend Yield 21.24% 8428 09. Summary (detailed analysis is required) 9-1. List your overall conclusion on the financial analysis. 9-2. Were the financial ratios and indicators accurate reflection of business performance? 9-3. Comment on the company's financial condition: excellent, healthy, or ill. 9-4. Is the stock over, under, or fairly-priced? 9-5. Is the stock a good investment candidate? Buy or Sell? From Balance sheet Account Receivable Inventories Current asset Total assets Account payable Total Current Liabilities Total liabilities Long-Term Debt Total long-term liabilities Total stockholders' equity Book value pershare Receivables Inventory Total Current Assets Total Assets Accounts Payable Total Current Liabilities Total Liabilities Long-Term Debt Total Long-Term Liabilities Shareholders' Equity Book Value Per Share 2020 20,215 18,447 52,008 525,761 50.051 63,438 346,521 175,977 283,083 161,673 22.69 2019 22,636 12,434 54,761 551,669 45,956 68,911 349,735 173,113 280,824 184,221 25.22 2018 26,472 7.713 51,427 531,864 43,184 64,420 337,980 166.250 273,560 184,089 25.29 2017 16,522 0 79.146 444,097 34.470 81.389 302.090 125.972 220.701 140.861 22.95 2016 16,794 0 38,369 403,821 31,138 50,576 279,711 113,681 229.135 123.135 20.05 From income statement Total Revenue Cost of Revenue Total Operating Expenses Operating Income Interest Expense Net Income EPS (Basic) Shares Outstanding Basic) Revenue Cost of Revenue Operating Expenses Operating Income Interest Expense/Income Net Income EPS (Basic) Shares Outstanding (Basic) 2020 171,760 79,920 85,435 6.405 7.925 -5,176 -0.75 7,126 2019 181,193 84,141 69,097 27,955 8.422 13.903 1.9 7,305 2018 170.756 79.419 65.241 26,096 7,957 19,370 2.85 7.278 2017 160 546 77.810 62.766 19.970 6.300 29.450 4.77 6.139 2016 163,786 77,190 63,053 23,543 4,910 12,976 2.1 6,141 From cash flow statement Total Cash Flow From Operating Activities Total Cash Flows From Investing Activities Total Cash Flows From Financing Activities Net Cash Flow Free cash flow Dividend paid Operating Cash Flow Investing Cash Flow Financing Cash Flow Net Cash Flow Free Cash Flow Dividend Paid 2020 43.130 -13,548 -32,007 -2.425 27,455 -14,956 2019 48.668 - 16,690 -25.083 6,895 29,033 -14,888 2018 43,602 -63.145 -25.989 -45,532 22,351 -13.410 2017 38.010 -18.943 25,930 44.997 17.363 -12.038 2016 38,442 -23,318 - 14,462 662 16.926 -11.797 From ratios Year Market Capitalization Enterprise Value PE Ratio PS Ratio PB Ratio 2020 204,944 374,651 -38.17 1.19 1.27 2019 285,479 458,300 20.54 1.58 1.55 2018 207,714 379,015 10.72 1.22 1.13 2017 238.684 352.532 8.11 1.49 1.69 2016 261.177 378,902 20.13 1.6 2.12 Overview Year Market Capitation Totalsts Total Total city Revenue Net Income Free cash flow Price Total retur 2020 204,944.00 525,761.00 346,52100 179,240.00 171,760.00 5,175.00 27 A55.00 28.76 -31.28% 2019 285 479.00 551,669.00 349.735.00 201.934 00 181,193.00 13.903.00 29013.00 39.08 29.79% 2018 207,714.00 531 864.00 337.980.00 193 884.00 170.756.00 19 270.00 22,35100 2854 -311 2017 238 684.00 444097.00 302.090.00 14200200 160,546,00 29,450.00 17,363.00 38.88 -13.19% 2016 261, 177.00 403.821 00 279.711.00 124.110.00 163,786.00 12,976.00 16,926.00 4253 from owner's pespective 2017 Year Return on Equity Return on Asset 2020 -2.89% -0.98% 2019 6.88% 2.52% 2018 9.99% 3.64% 20.74% 663N 2016 10 46% 321% 2019 2017 Year Cashflow from Cash flow from investing Ciohow from financing Net change in Cash CADEC Free cash flow 2020 43110 13.548 -32,007 2.425 15675 27455 48 668 -16,690 -25083 6895 19635 29033 2018 43602 63.165 -25,989 -45 S12 21 251 22.151 38010 -18.943 25.930 44 997 20647 17,368 2016 38442 -23,318 -14462 662 21 516 16,926 manager profitability, Dupont identity Year Nam Lottumor Equity mult 2020 B01N 033 2019 767 03 273 2010 11 JAN 012 2.34 2017 10 NON 0.36 2016 79N 041 291 66IN Return on to Return on fuity 090N -2.89% 2.52 6.88% 364 9.99% 1215 10 46'N 20.74% Manager: efficiency Year Account collection red ventary Rodin 2020 42.96 4425 2019 45.60 5394 2018 56.59 2017 37.56 0.00 2016 3743 0.00 Manager: Cost-volume analysis Year Ricevenue VC: cost of revenues TC Total operatione pense Coed cost VCR Variable cost revenue SR Survival Revenue I/1.VCR) R/SR 2020 171,760.00 79920.00 85 435.00 93,360.00 0.47 174,602.72 098 2019 191 193.00 84,14100 69,097.00 77,519.00 0.46 144,72551 1.25 2018 170,756.00 79419.00 65 241.00 73198.00 0.47 136,84485 125 2017 160 546.00 77 $10.00 62.766.00 69.066.00 048 134,019.90 120 2016 163.786.00 77,190.00 63,05300 67.963.00 0.47 128.543 90 127 Short-term liquidity You Current Asset Current 2020 52,008,00 6343800 18 44700 DR2 0.53 2019 54.761.00 68.911.00 12.434.00 0.29 961 2018 5142700 64 420.00 7.71300 0.80 068 2017 29,145 00 81.389.00 0.00 097 0.92 2016 38,369.00 SO 576.00 0.00 076 0.26 Current Quick Long term solvency Year To Totales Total stockholdenequity Debt ratio Debt/Equity Net operating Income interest and Interest coverage ratio 2020 525.761.00 346,521 00 179.240.00 0.66 1.93 2019 551 669.00 349.735.00 201,934.00 0.63 1.73 27955 8422.00 3.32 2018 531 86400 337.980.00 193.884.00 0.64 1.74 26096 7,957 00 3.28 2017 444,097.00 302.090.00 142.007.00 0.68 2.13 19.970 6,300.00 3.17 2016 403821.00 279 711 00 124,110.00 0.69 2.25 23,543 4,910.00 4.79 6405 7,925.00 0.81 Market ratios Yew Price per share Laris per share Basic Dividend per the basic Price-aming ratio Prices Price-book ratio totum 2020 28,63 -0.75 -2.098793152 -38.17 119 1.22 -31 78% 2019 39.03 1.9 -2.038056126 2054 158 155 2017 38.68 4.77 -1960905685 2016 30.55 2.85 -1842539159 10.72 1.22 1.13 2016 42.27 2.1 -1921022635 20.13 16 712 1.49 169 11.19% 29 79% NELIE Market value added OD New Martin Book of Marit dedocuity 2020 204.944.00 161.673.00 41,27100 2019 285 419.00 184 221.00 10:250.00 2010 202 214.00 184089.00 23,62500 2017 230684.00 140 86100 97421.00 2016 261,17700 123,135 00 138042.00 Mb Value of fim total set of flimkie 374551.00 525,76100 458,300.00 551569.00 379 15.00 531 86400 352 522.00 44409700 378 902.00 403.821.00 52-Week Price Chance Dividend Yield 21.24% 8428
Step by Step Solution
There are 3 Steps involved in it

Get step-by-step solutions from verified subject matter experts