

Question: 094/assignments/852284 1. Draw the scatter plot for the following sets of data and describe the correlation, if any, between X and Y. X: 0 3

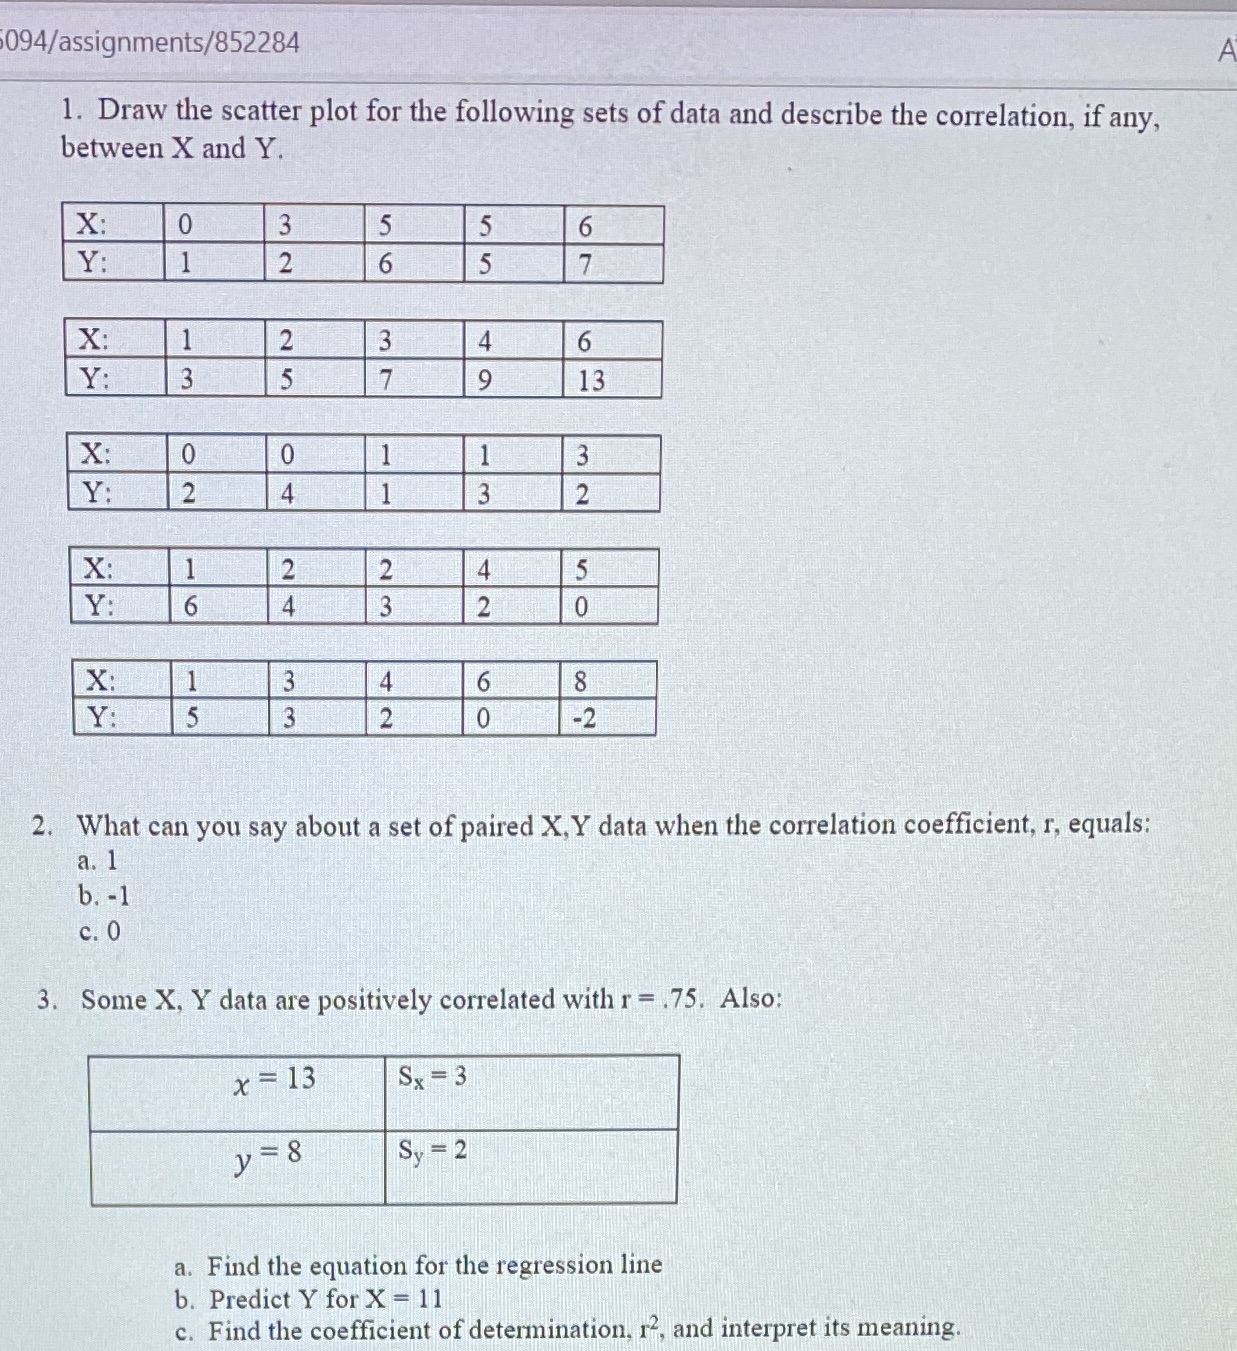
094/assignments/852284 1. Draw the scatter plot for the following sets of data and describe the correlation, if any, between X and Y. X: 0 3 5 6 Y: 1 2 6 5 7 X: 1 2 3 4 6 Y: 3 5 7 9 13 X: 0 0 1 3 Y: 2 4 1 3 2 X: 1 2 IN Y: 6 4 3 2 0 X: 1 3 4 6 8 Y: 5 3 2 0 -2 2. What can you say about a set of paired X, Y data when the correlation coefficient, r, equals: a. 1 b. -1 c. 0 3. Some X, Y data are positively correlated with r - .75. Also: x = 13 SX = 3 y -8 Sy = 2 a. Find the equation for the regression line b. Predict Y for X - 11 c. Find the coefficient of determination, 1, and interpret its meaning
Step by Step Solution
There are 3 Steps involved in it
1 Expert Approved Answer
Step: 1 Unlock

Question Has Been Solved by an Expert!
Get step-by-step solutions from verified subject matter experts
Step: 2 Unlock
Step: 3 Unlock