

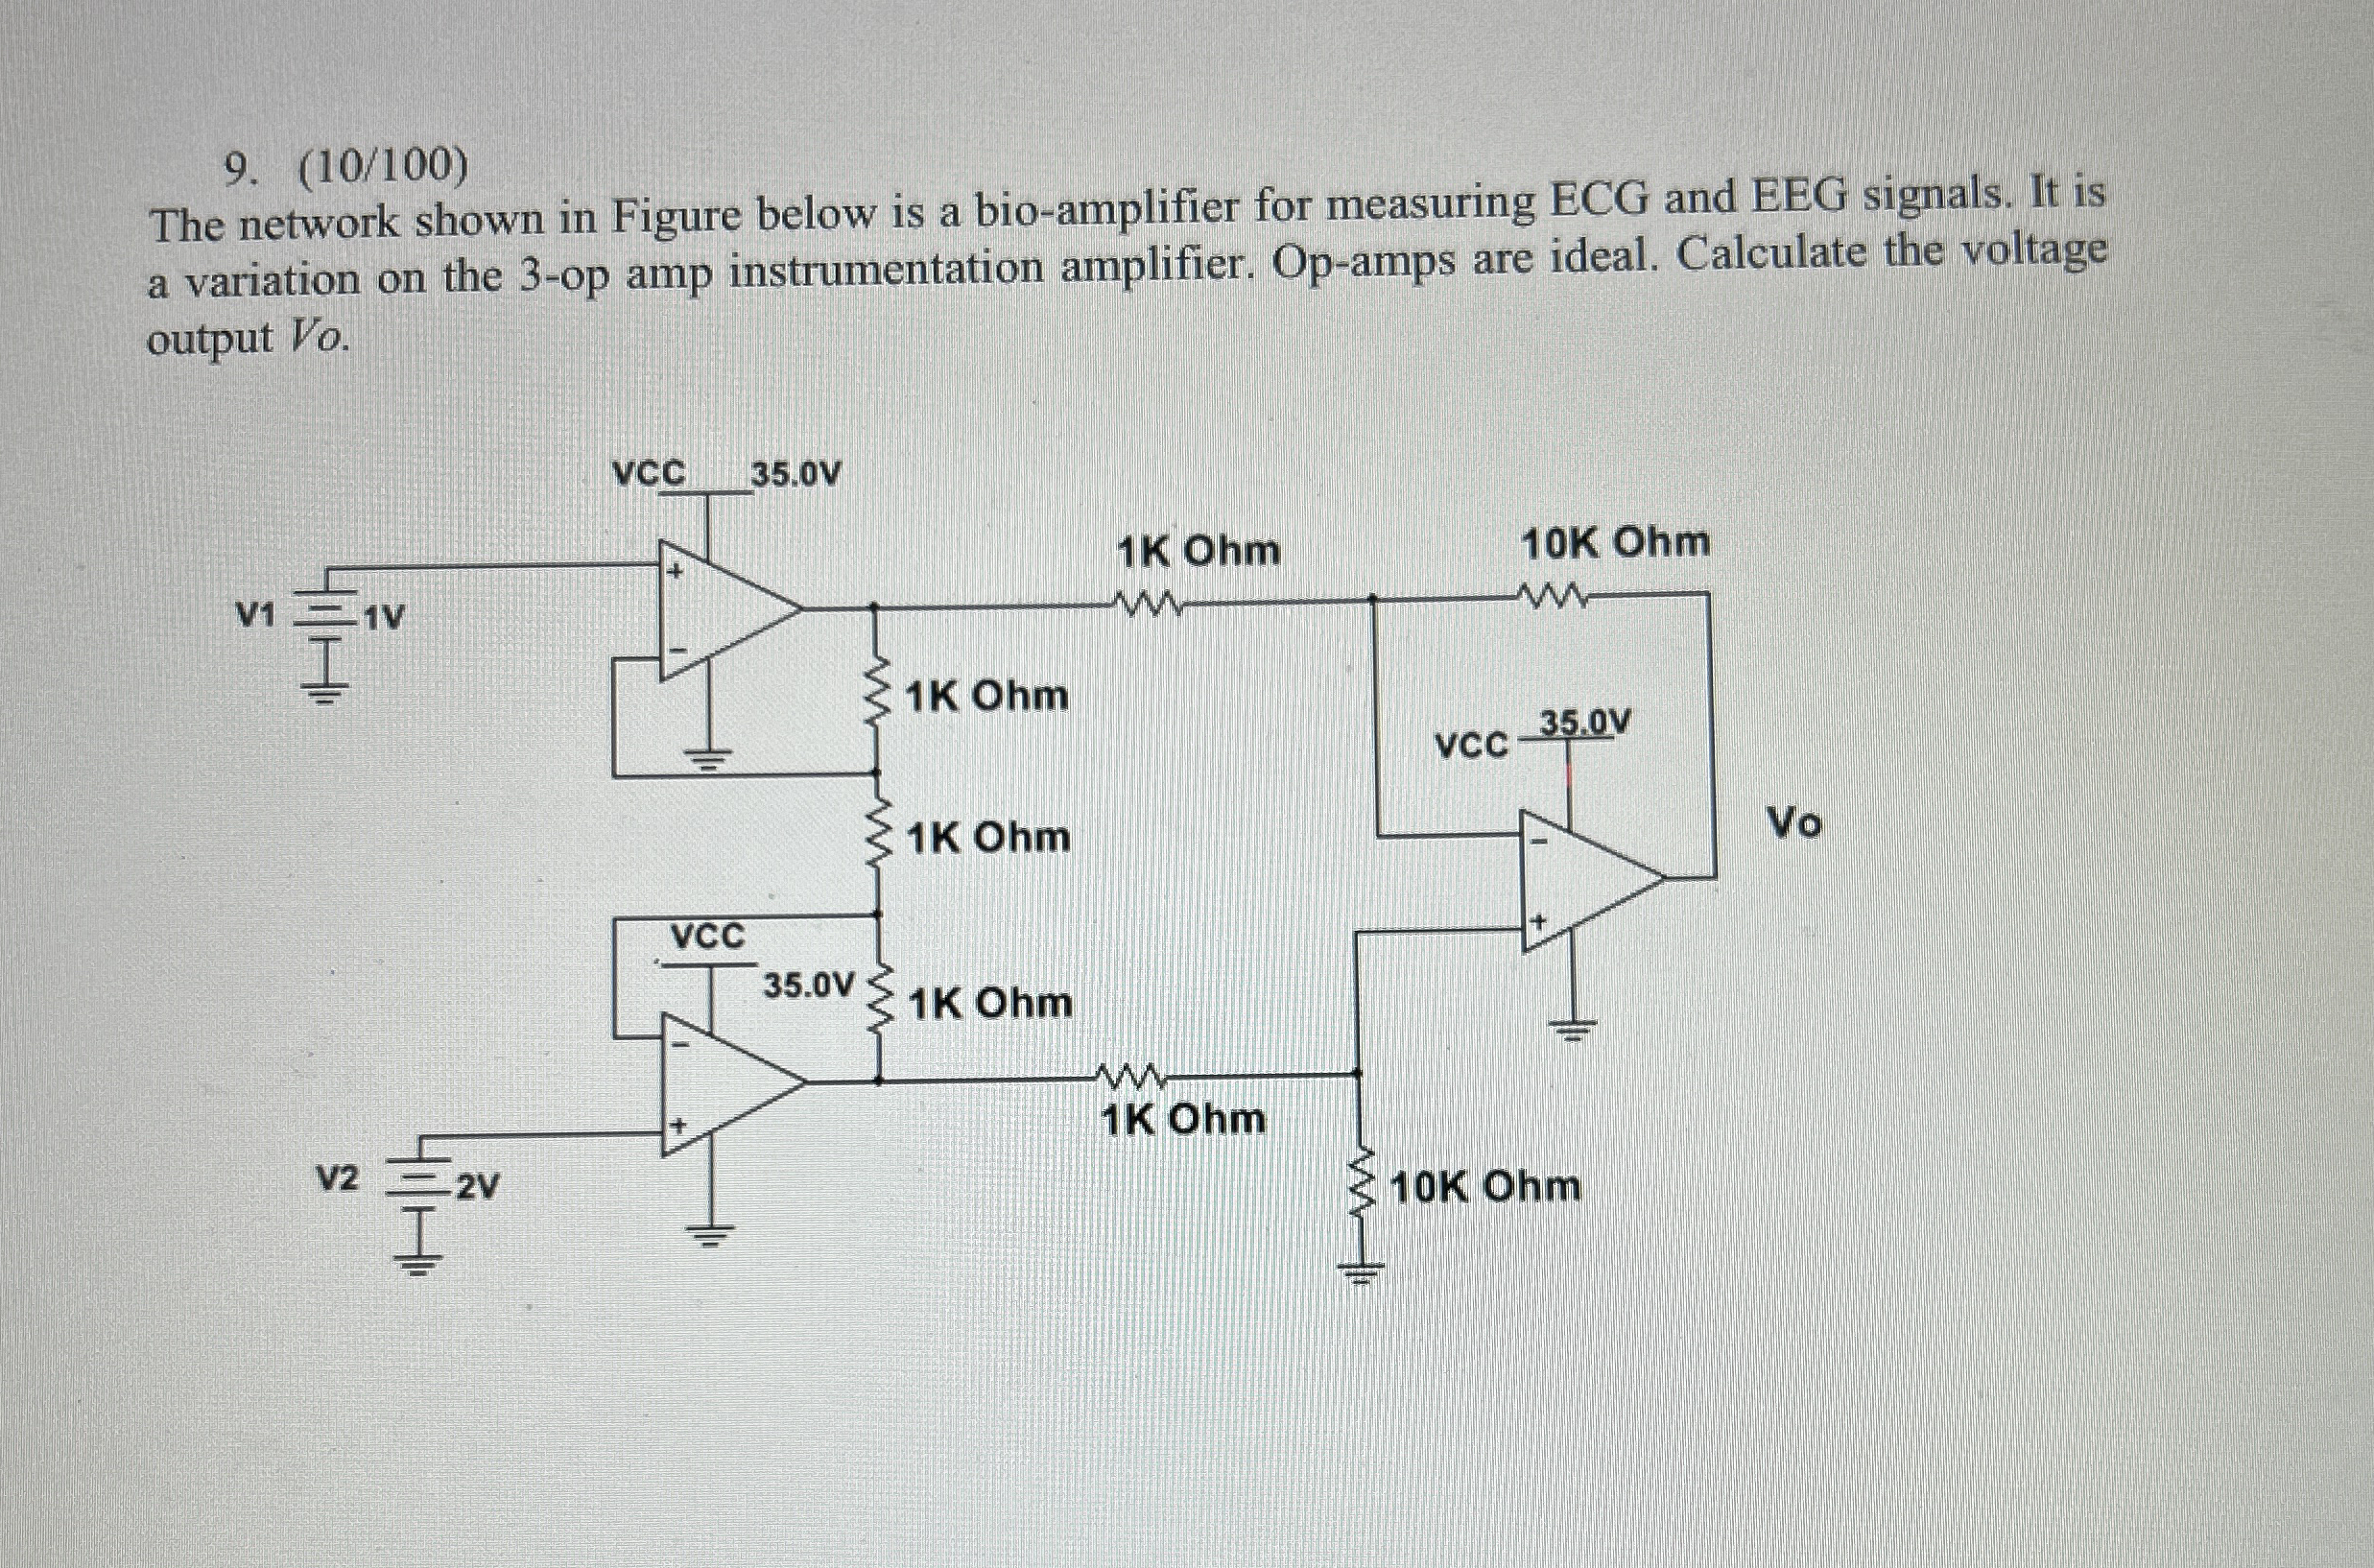
Question: ( 1 0 1 0 0 ) The network shown in Figure below is a bio - amplifier for measuring ECG and EEG signals. It
The network shown in Figure below is a bioamplifier for measuring ECG and EEG signals. It is a variation on the op amp instrumentation amplifier. Opamps are ideal. Calculate the voltage output Vo
Step by Step Solution
There are 3 Steps involved in it
1 Expert Approved Answer
Step: 1 Unlock

Question Has Been Solved by an Expert!
Get step-by-step solutions from verified subject matter experts
Step: 2 Unlock
Step: 3 Unlock