

Question: 1 0 1 2 3 4 5 6 Velocity vs. Time The velocity graph represents a vehicle's velocity in miles per hour during a three-hour


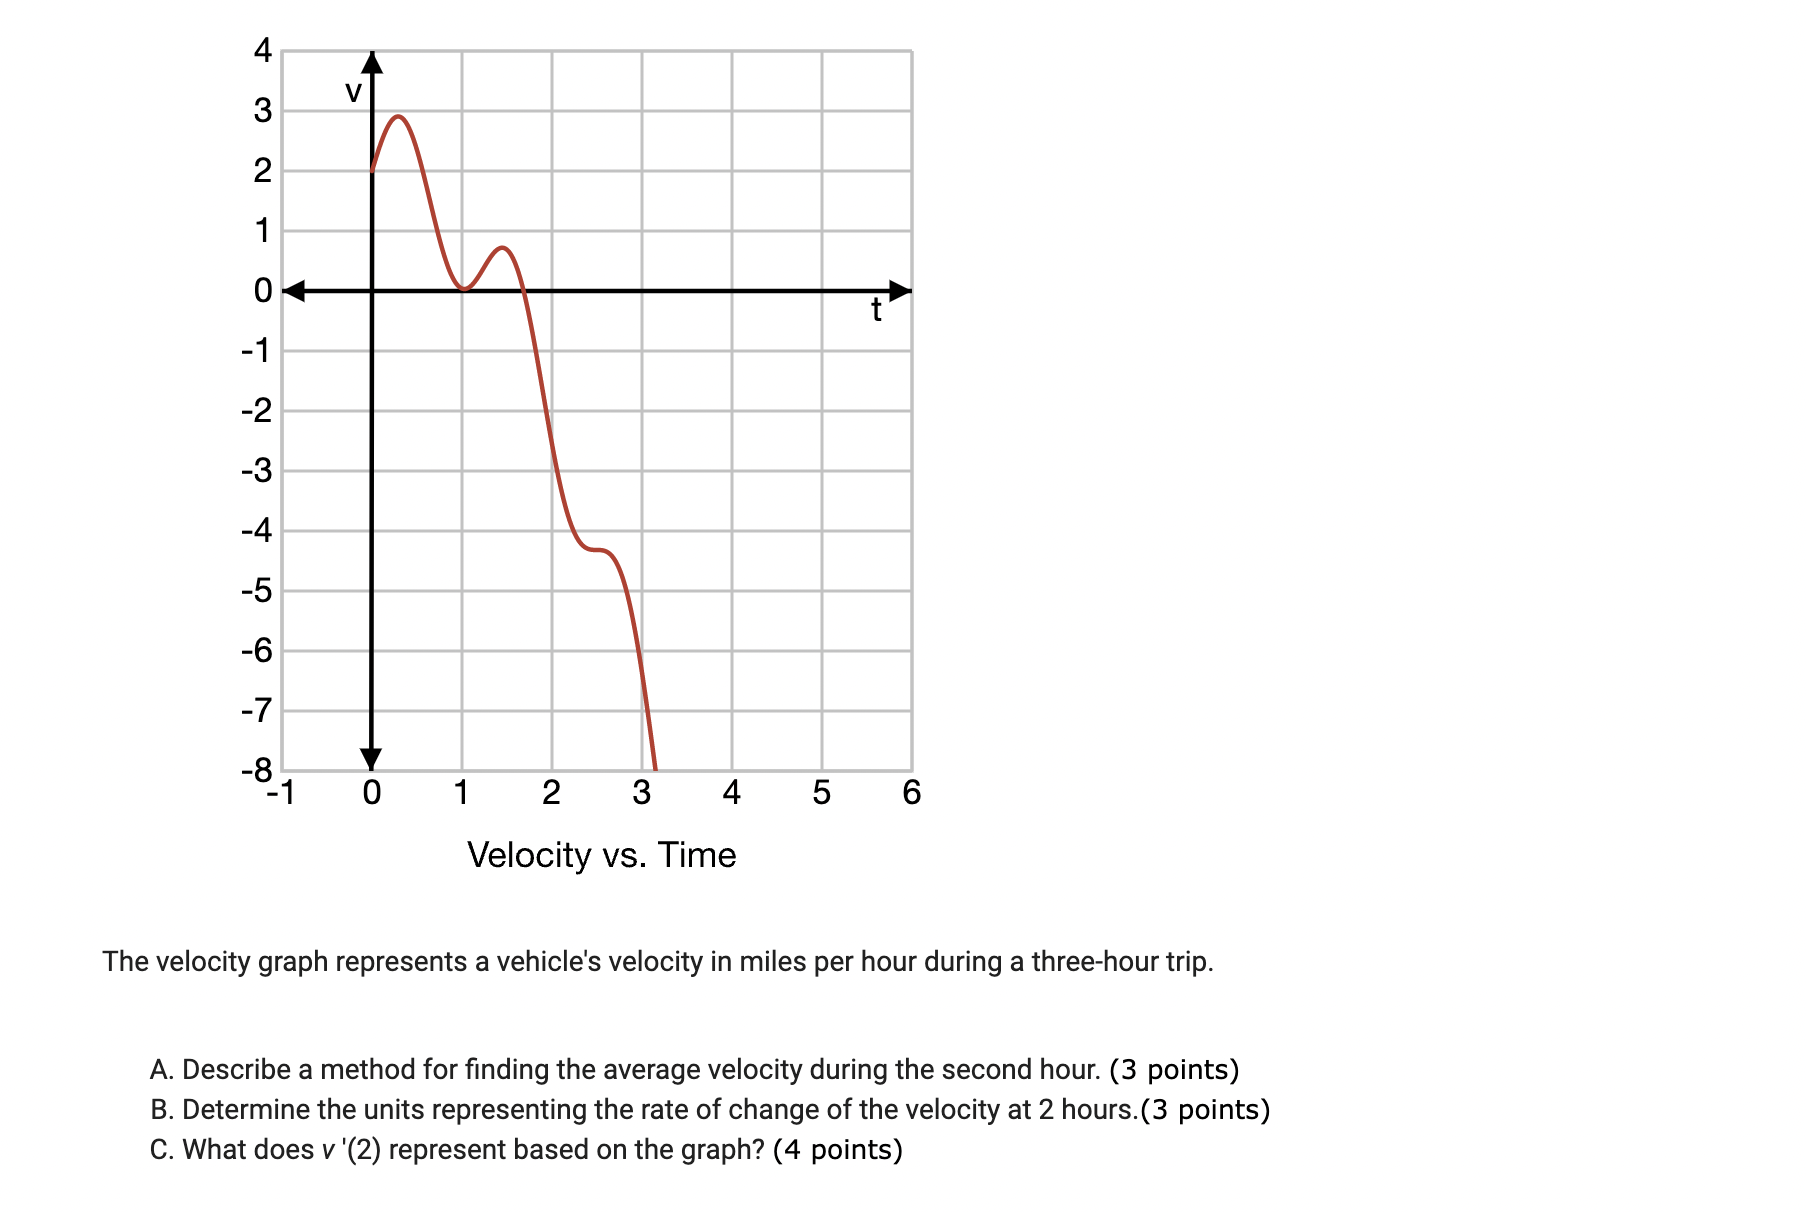

1 0 1 2 3 4 5 6 Velocity vs. Time The velocity graph represents a vehicle's velocity in miles per hour during a three-hour trip. A. Describe a method for nding the average velocity during the second hour. (3 points) B. Determine the units representing the rate of change of the velocity at 2 hours.(3 points) C. What does v '(2) represent based on the graph? (4 points) Q 7. (04.03 HC) A constant volume of cookie dough is formed into a cylinder with a relatively small height and large radius. When the cookie dough is placed into the oven, the height of the dough decreases as the radius increases, but it retains its cylindrical shape. At time t, the height of the dough is 6 mm, the radius of the dough is 20 mm, and the radius of the dough is increasing at a rate of 2 mm per minute. Part A: At time t, at what rate is the area of the circular surface of the cookie dough increasing with respect to time? (5 points) Part B: At time t, at what rate is the height of the dough decreasing with respect to time? (5 points)
Step by Step Solution
There are 3 Steps involved in it

Get step-by-step solutions from verified subject matter experts