

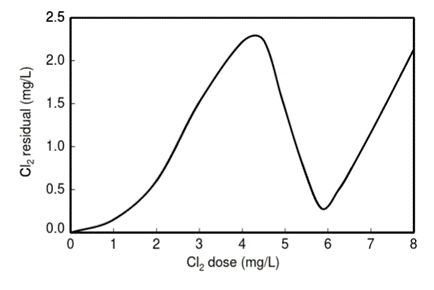
Question: 1 0 - 1 7 . Figure 1 0 - Pr 1 7 shows a breakpoint chlorination curve for a water supply source. ( a
Figure Pr shows a breakpoint chlorination curve for a water supply source. a Identify the chlorine dose or the range of doses where the following statements apply: i The free Cl residual is mgLii The combined Cl residual is mgLiii The chlorine demand is mgLiv When a small increment of chlorine is added, most of it undergoes no redox reaction. v When a small increment of chlorine is added, most of it reacts with Ncontain ing compounds. vi When a small increment of chlorine is added, most of it is reduced to Clb What is the chlorine demand when the chlorine dose is mgL
Step by Step Solution
There are 3 Steps involved in it
1 Expert Approved Answer
Step: 1 Unlock

Question Has Been Solved by an Expert!
Get step-by-step solutions from verified subject matter experts
Step: 2 Unlock
Step: 3 Unlock