

Question: 1 0 3 points In a scatter plot, which of the following elements is imposed on the plot area to show the general trend of
points
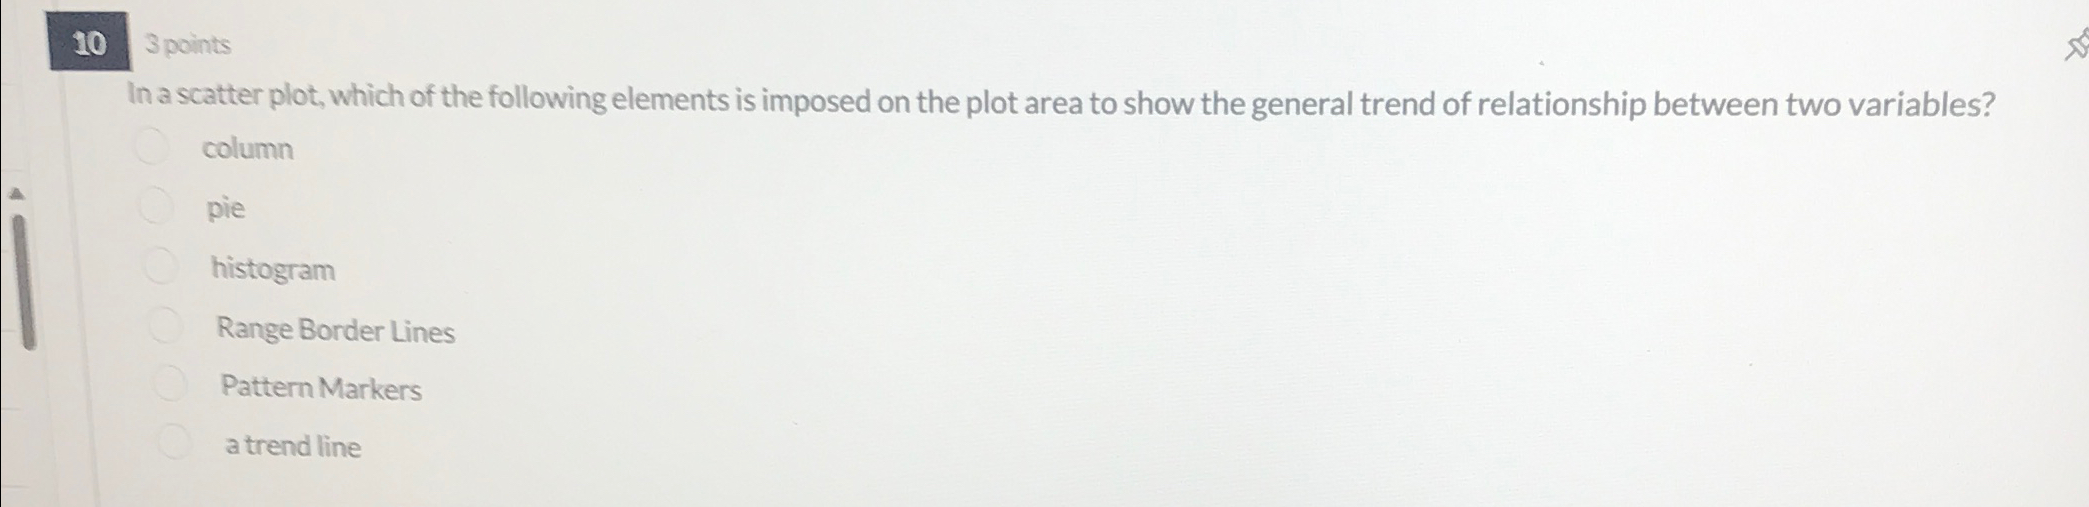
In a scatter plot, which of the following elements is imposed on the plot area to show the general trend of relationship between two variables?
column
pie
histogram
Range Border Lines
Pattern Markers
a trend line
Step by Step Solution
There are 3 Steps involved in it
1 Expert Approved Answer
Step: 1 Unlock

Question Has Been Solved by an Expert!
Get step-by-step solutions from verified subject matter experts
Step: 2 Unlock
Step: 3 Unlock