

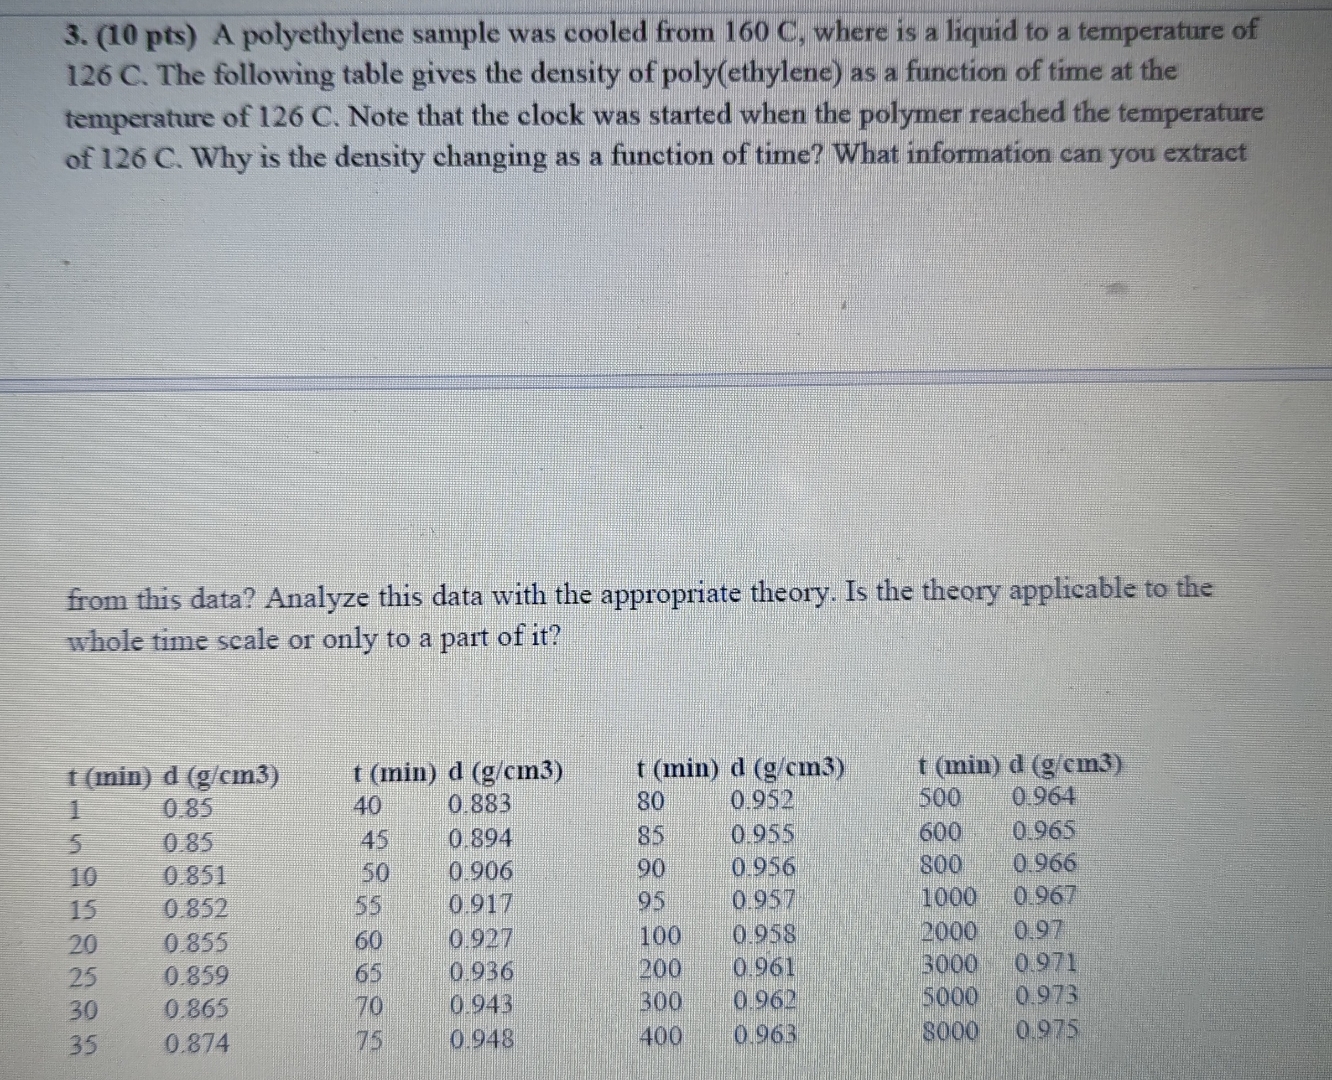
Question: ( 1 0 p t s ) A polyethylene sample was cooled from 1 6 0 C , where is a liquid to a temperature
A polyethylene sample was cooled from where is a liquid to a temperature of The following table gives the density of polyethylene as a function of time at the temperature of Note that the clock was started when the polymer reached the temperature of Why is the density changing as a function of time? What information can you extract
from this data? Analyze this data with the appropriate theory. Is the theory applicable to the whole time scale or only to a part of it
table
Step by Step Solution
There are 3 Steps involved in it
1 Expert Approved Answer
Step: 1 Unlock

Question Has Been Solved by an Expert!
Get step-by-step solutions from verified subject matter experts
Step: 2 Unlock
Step: 3 Unlock