

Question: ( 1 0 % ) Plotting. Problem 2 . 1 . ( 5 % ) Consider 7 5 equally spaced values of x in the
Plotting.
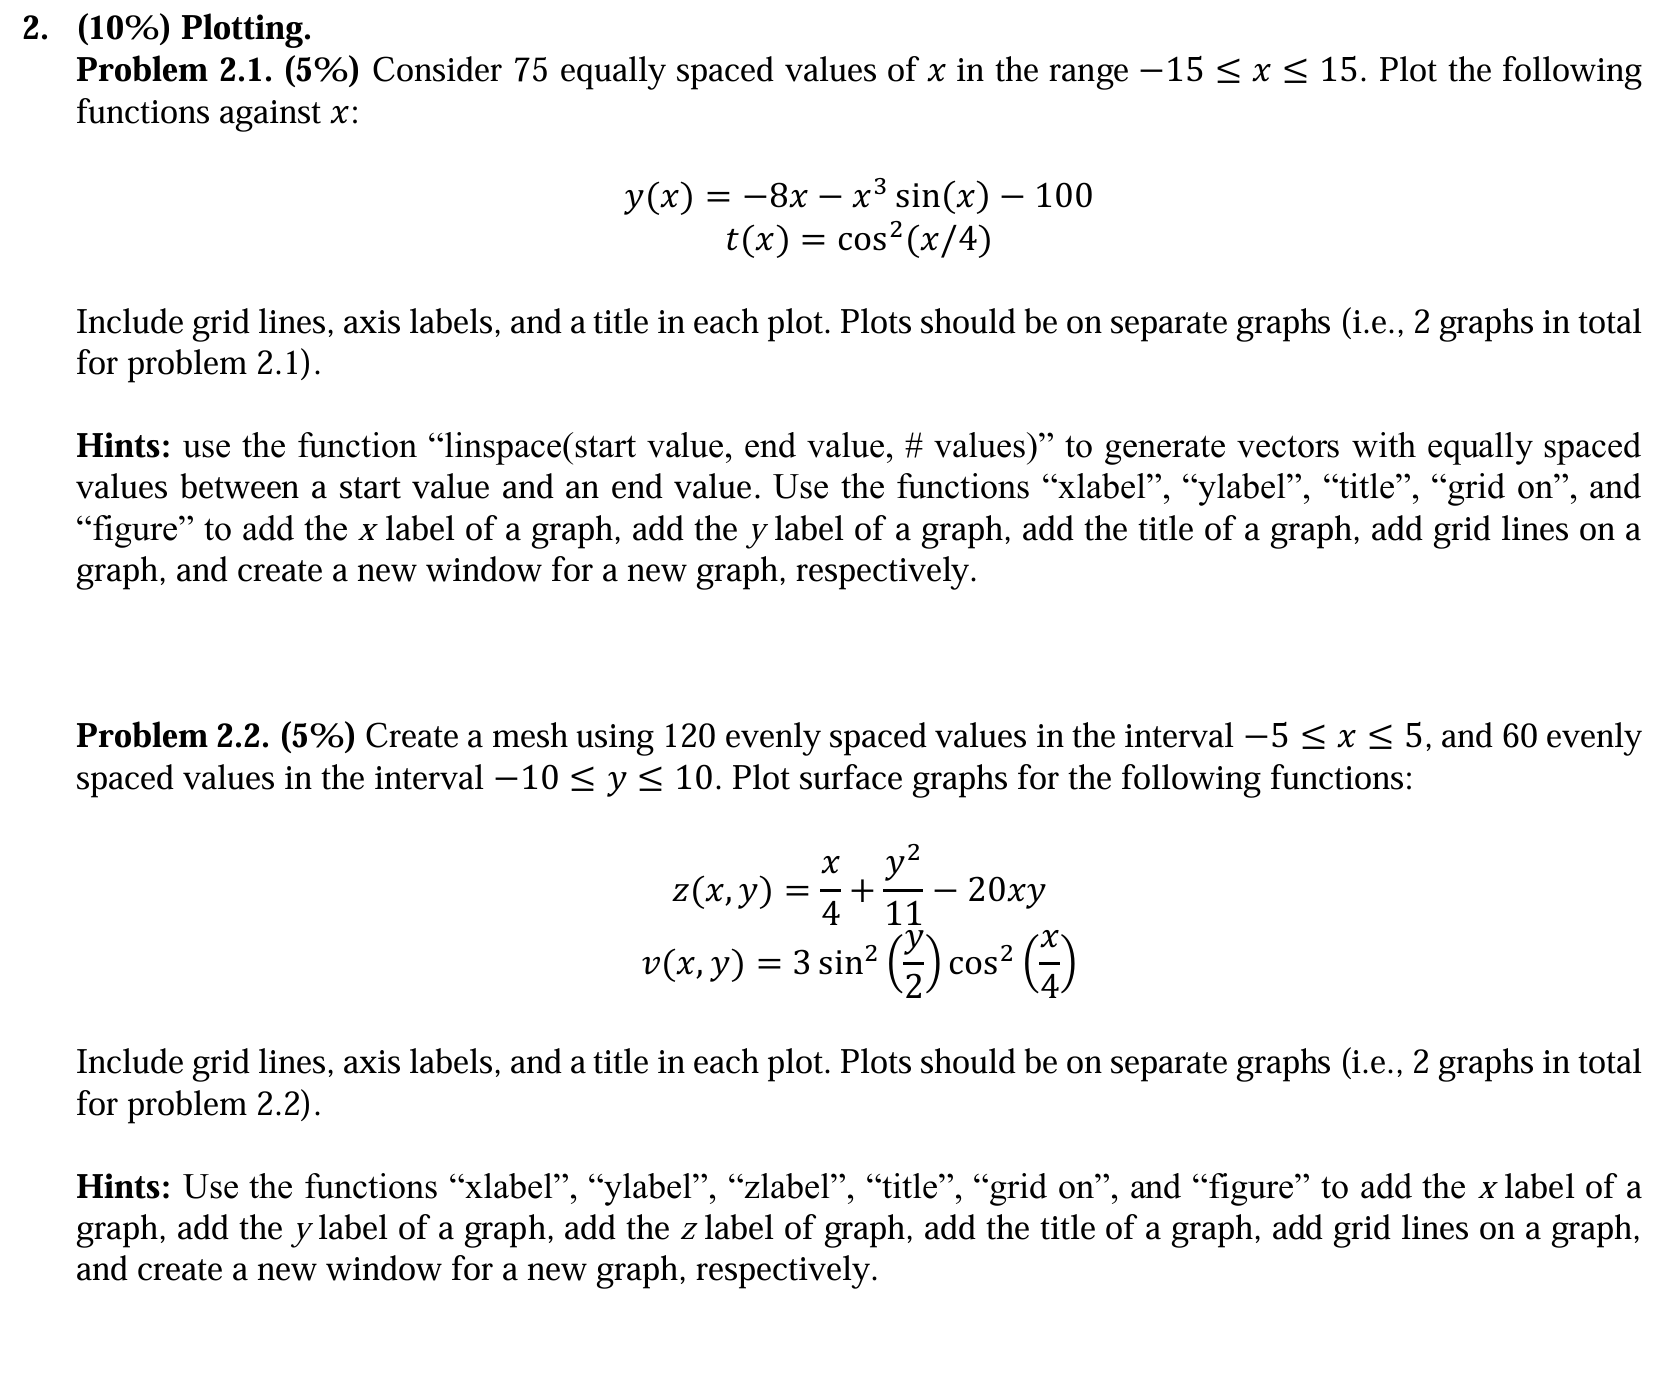
Problem Consider equally spaced values of in the range Plot the following
functions against :
Include grid lines, axis labels, and a title in each plot. Plots should be on separate graphs ie graphs in total
for problem
Hints: use the function "linspacestart value, end value, # values to generate vectors with equally spaced
values between a start value and an end value. Use the functions "xlabel", "ylabel", "title", "grid on and
"figure" to add the label of a graph, add the label of a graph, add the title of a graph, add grid lines on a
graph, and create a new window for a new graph, respectively.
Problem Create a mesh using evenly spaced values in the interval and evenly
spaced values in the interval Plot surface graphs for the following functions:
Include grid lines, axis labels, and a title in each plot. Plots should be on separate graphs ie graphs in total
for problem
Hints: Use the functions "xlabel", "ylabel", "zlabel", "title", "grid on and "figure" to add the label of a
graph, add the label of a graph, add the label of graph, add the title of a graph, add grid lines on a graph,
and create a new window for a new graph, respectively.
Step by Step Solution
There are 3 Steps involved in it
1 Expert Approved Answer
Step: 1 Unlock

Question Has Been Solved by an Expert!
Get step-by-step solutions from verified subject matter experts
Step: 2 Unlock
Step: 3 Unlock