

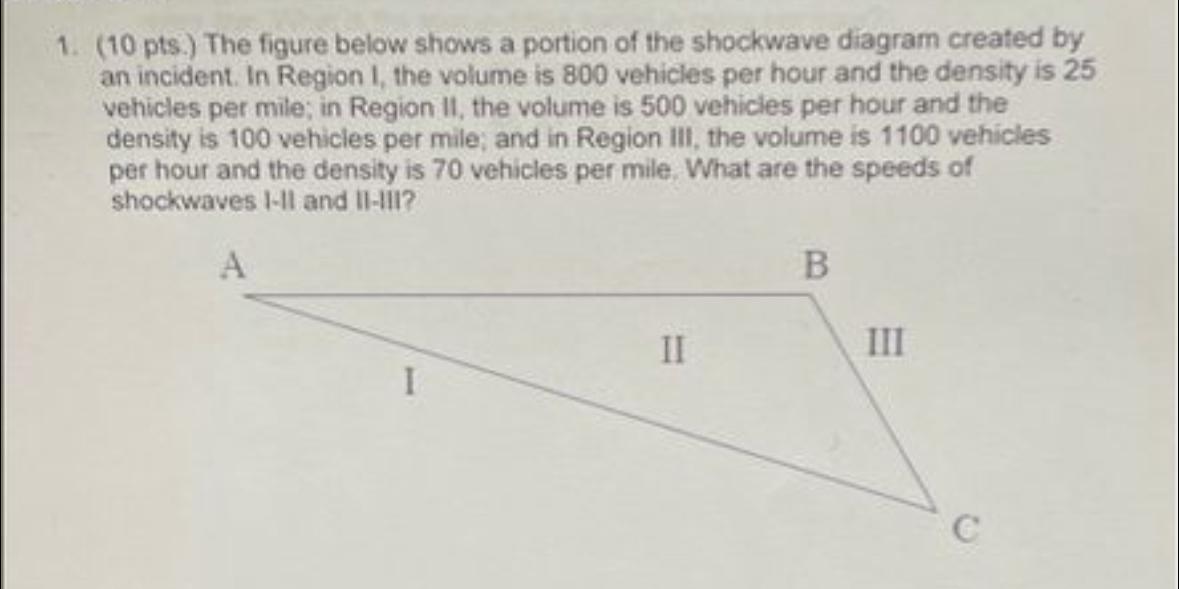
Question: ( 1 0 pts . ) The figure below shows a portion of the shockwave diagram created by an incident. In Region I, the volume
pts The figure below shows a portion of the shockwave diagram created by an incident. In Region I, the volume is vehicles per hour and the density is vehicles per mile; in Region II the volume is vehicles per hour and the density is vehicles per mile; and in Region III, the volume is vehicles per hour and the density is vehicles per mile. What are the speeds of shockwaves II and IIIII?
Step by Step Solution
There are 3 Steps involved in it
1 Expert Approved Answer
Step: 1 Unlock

Question Has Been Solved by an Expert!
Get step-by-step solutions from verified subject matter experts
Step: 2 Unlock
Step: 3 Unlock