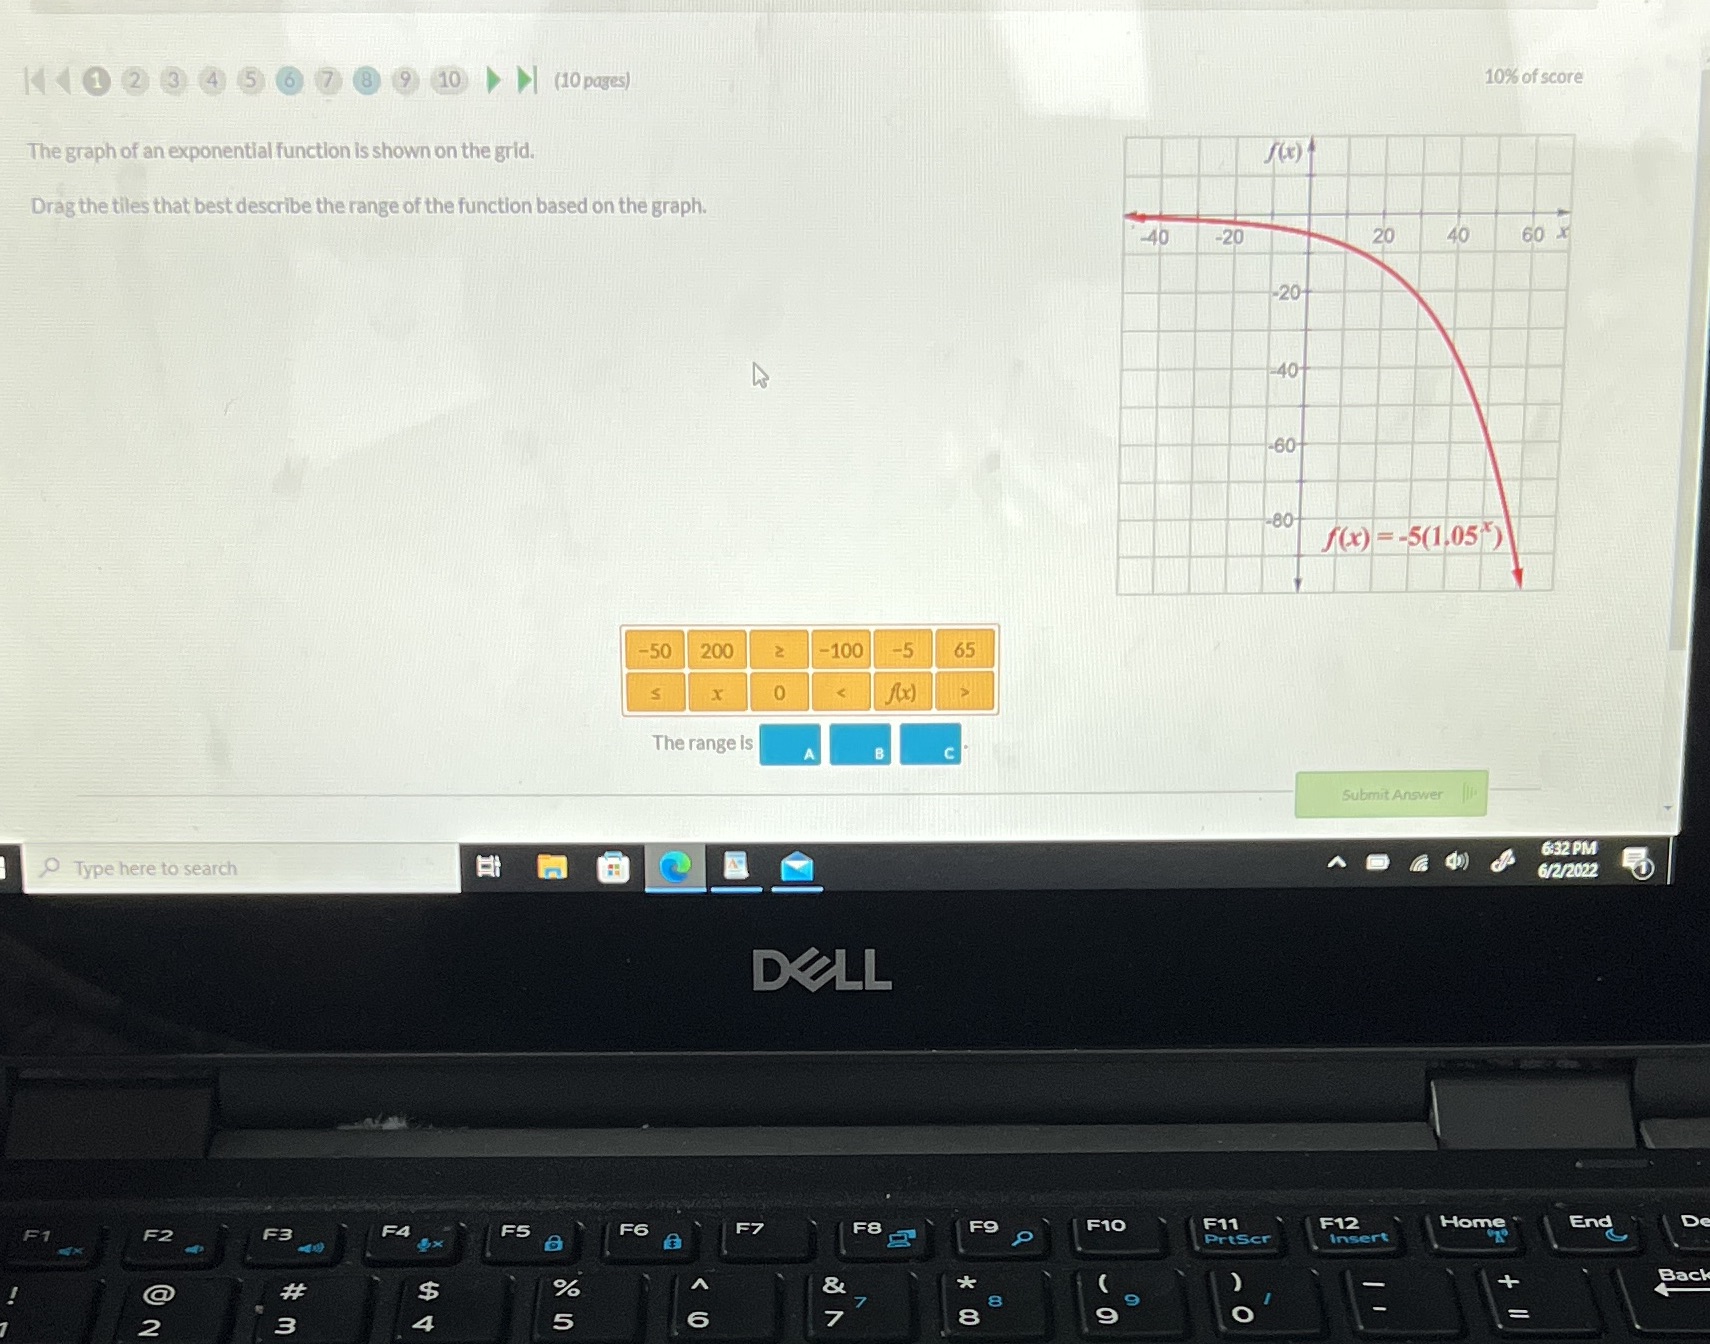
Question: 1 1 1 2 3 4 5 6 7 8 9 10 (10 pages) 10% of score The graph of an exponential function is shown

1 1 1 2 3 4 5 6 7 8 9 10 (10 pages) 10% of score
1 1 1 2 3 4 5 6 7 8 9 10 (10 pages) 10% of score The graph of an exponential function is shown on the grid. Drag the tiles that best describe the range of the function based on the graph. -40 -20 20 40 60 X -20 -40- -60 -80 f (x) = -5(1.05*) -50 200 2 -100 -5 65 S O ((x) The range is B Submit Answer 6:32 PM Type here to search 6/2/2022 DELL F4 FS F6 F7 F8 F9 F10 F11 Home End D F3 PrtScr Insert Back @ % 4 5

Step by Step Solution

There are 3 Steps involved in it

1 Expert Approved Answer
Step: 1 Unlock blur-text-image
Question Has Been Solved by an Expert!

Get step-by-step solutions from verified subject matter experts

Step: 2 Unlock
Step: 3 Unlock

Students Have Also Explored These Related Mathematics Questions!