

Question: 1 . 1 2 [ 1 0 / 1 0 / Discussion / 1 0 / 2 0 / Discussion ] 1 . 7 >
DiscussionDiscussion Make the following calculations on
the raw data in order to explore how different measures color the conclusions one
can make. Doing these exercises will be much easier using a spreadsheet.
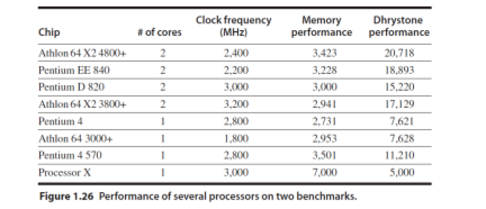
a Create a table similar to that shown in Figure except express
the results as normalized to the Pentium D for each benchmark.
b Calculate the arithmetic mean of the performance of each proces
sor. Use both the original performance and your normalized performance cal
culated in part a
cDiscussion Given your answer from part b can you draw any con
flicting conclusions about the relative performance of the different proces
sors?
d Calculate the geometric mean of the normalized performance of
the dual processors and the geometric mean of the normalized performance
of the single processors for the Dhrystone benchmark. begintabularlcccc
hline Chip & # of cores & begintabularc
Clock frequency
mathrmMHz
endtabular & begintabularc
Memory
performance
endtabular & begintabularc
Dhrystone
performance
endtabular
hline Athlon X & & & &
hline Pentium EE & & & &
hline Pentium D & & & &
hline Athlon X & & & &
hline Pentium & & & &
hline Athlon & & & &
hline Pentium & & & &
hline Processor X & & & &
hline
endtabular
Figure Performance of several processors on two benchmarks.
Step by Step Solution
There are 3 Steps involved in it
1 Expert Approved Answer
Step: 1 Unlock

Question Has Been Solved by an Expert!
Get step-by-step solutions from verified subject matter experts
Step: 2 Unlock
Step: 3 Unlock