

Question: $ 1 1 $ 9 $ 5 $ 4 Step 1 Step 1 Station W Station W Step 2 Step 2 Station Y Station Z
$
$
$
$
Step
Step
Station W
Station W
Step
Step
Station Y
Station Z
Product A
Product B
Raw materials
Raw materials
min
min
min
min
Purchased part
Step
Product C
Step
Station X
Purchased part
Purchased part
Raw materials
Station W
$
$
min
min
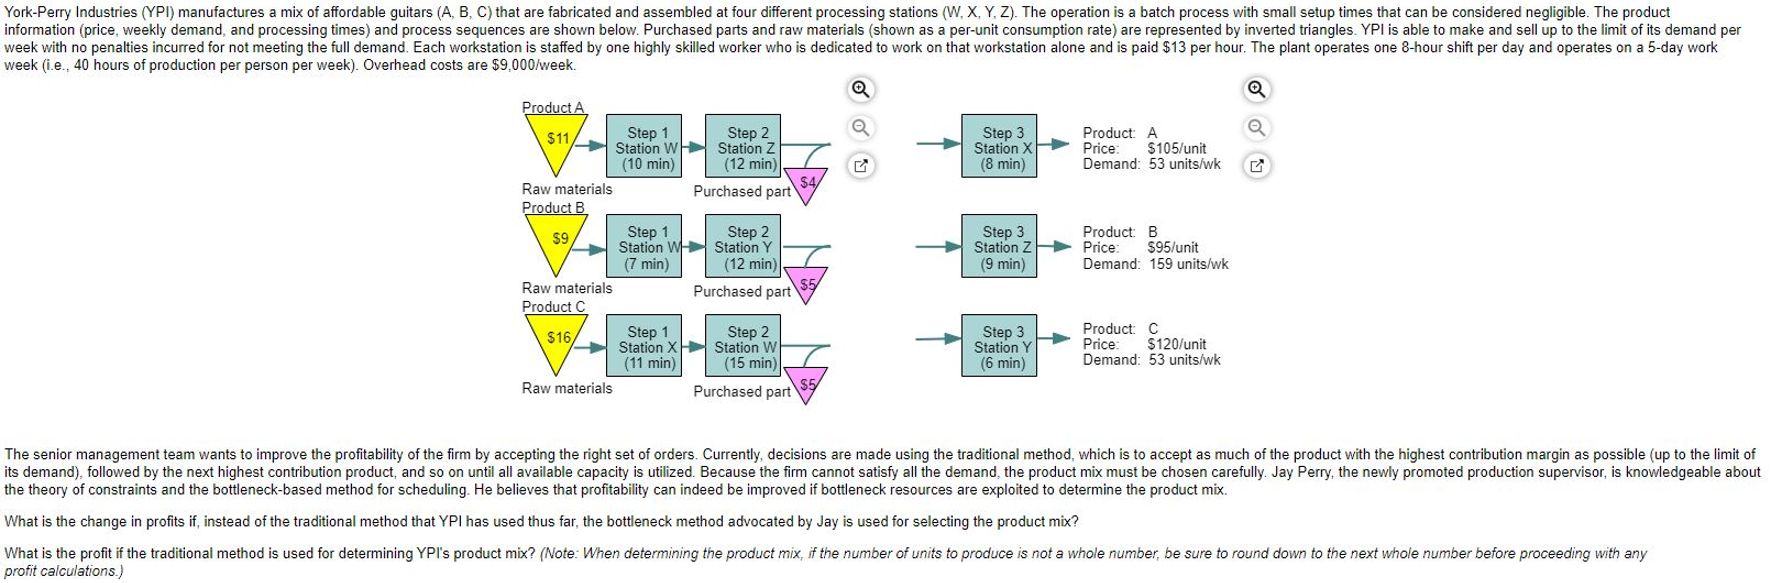
In the diagram, a flowchart represents the manufacturing process of products A B and C in different rows. From top to bottom, rows are arranged for Product A Product B and Product C respectively. Each row begins with an inverted triangle containing the dollar amount for the raw materials that go into the process. An arrow that emerges from the triangle is followed to the right by a series of rectangles for each step in the process. Each rectangle contains the step number, station name where that step takes place, and duration in minutes for that step. Between steps and each process has a purchased part added to the flow as indicated by an inverted triangle with the dollar amount for the purchased part inside. The final step in each process is followed by an arrow to a summary process that shows the product name, price per unit, and demand in units per week for that product. For product A a value of $ is displayed inside the initial triangle. For Step Station W is used and the step takes minutes. For Step Station Z is used and the step takes minutes. After step a purchased part costing $ is added to the flow. For Step Station X is used and the step takes minutes. The final output arrow points to summary process that reads Product: A Price: $ per unit, and Demand: units per week. For product B a value of $ is displayed inside the initial triangle. For Step Station W is used and the step takes minutes. For Step Station Y is used and the step takes minutes. After step a purchased part costing $ is added to the flow. For Step Station Z is used and the step takes minutes. The final output arrow points to summary process that reads Product: B Price: $ per unit, and Demand: units per week. For product C a value of $ is displayed inside the initial triangle. For Step Station X is used and the step takes minutes. For Step Station W is used and the step takes minutes. After step a purchased part costing $ is added to the flow. For Step Station Y is used and the step takes minutes. The final output arrow points to summary process that reads Product: C Price: $ per unit, and Demand: units per week.
Step
Step
Station X
Station Z
Product: A
Product: B
min
min
Price: $unit
Demand: unitswk
Demand: unitswk
Price: $unit
Step
Station Y
min
Product: C
Price: $unit
Demand: unitswk
x y graph
Part
The senior management team wants to improve the profitability of the firm by accepting the right set of orders. Currently, decisions are made using the traditional method, which is to accept as much of the product with the highest contribution margin as possibleup to the limit of its demand followed by the next highest contribution product, and so on until all available capacity is utilized. Because the firm cannot satisfy all the demand, the product mix must be chosen carefully. Jay Perry, the newly promoted production supervisor, is knowledgeable about the theory of constraints and the bottleneckbased method for scheduling. He believes that profitability can indeed be improved if bottleneck resources are exploited to determine the product mix.
What is the change in profits if instead of the traditional method that YPI has used thus far, the bottleneck method advocated by Jay is used for selecting the product mix?
Part
What is the profit if the traditional method is used for determining YPI's product mix? Note: When determining the product mix, if the number of units to produce is not a whole number, be sure to round down to the next whole number before proceeding with any profit calculations.
Step by Step Solution
There are 3 Steps involved in it
1 Expert Approved Answer
Step: 1 Unlock

Question Has Been Solved by an Expert!
Get step-by-step solutions from verified subject matter experts
Step: 2 Unlock
Step: 3 Unlock