

Question: 1 1. In this problem we use Regression Analysis to test the hypothesis that Dividends per share significantly affects price per share of a company.
1
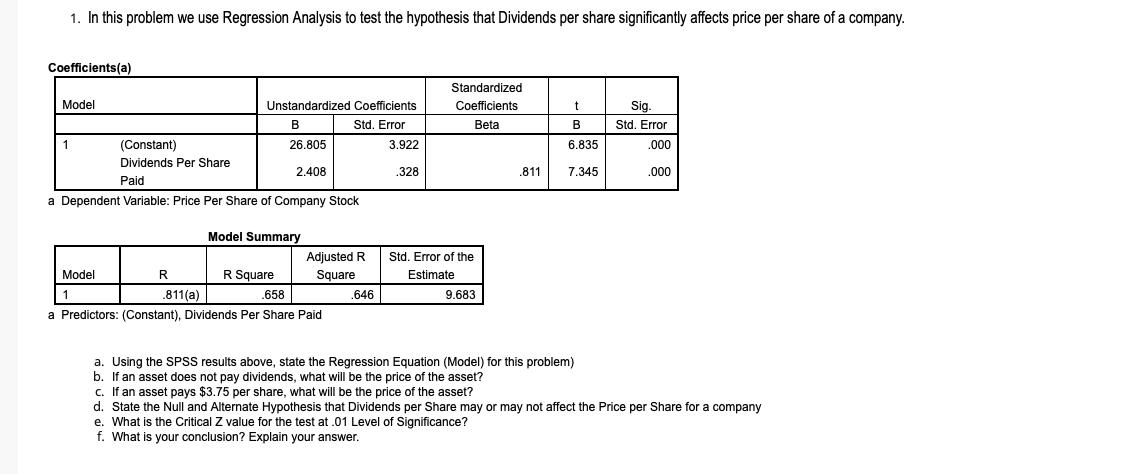
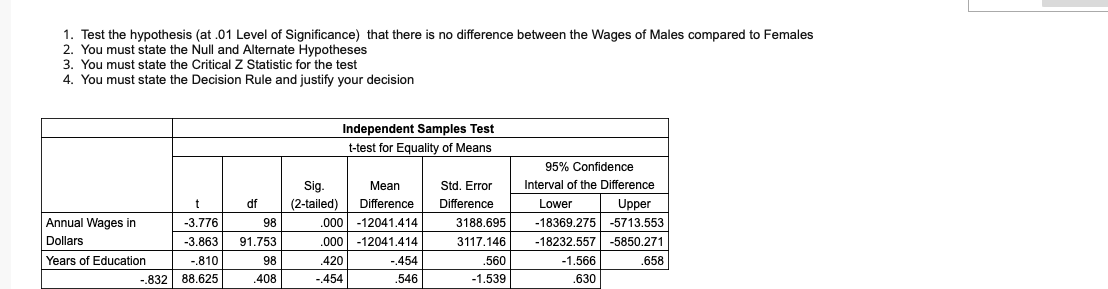
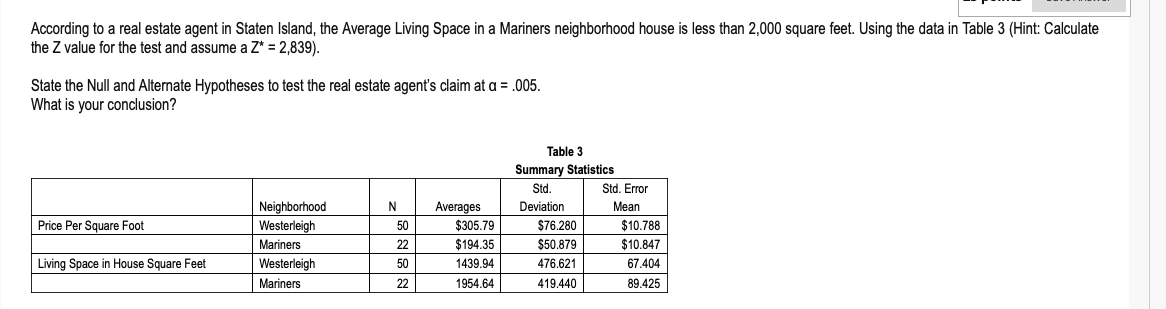
1. In this problem we use Regression Analysis to test the hypothesis that Dividends per share significantly affects price per share of a company. Coefficients(a) Standardized Model Unstandardized Coefficients Coefficients Sig. B Std. Error Beta Std. Error (Constant) 26.805 3.922 6.835 000 Dividends Per Share 2.408 .328 .811 7.345 .000 Paid a Dependent Variable: Price Per Share of Company Stock Model Summary Adjusted R Std. Error of the Model R R Square Square Estimate 811(a) 658 646 9.683 a Predictors: (Constant), Dividends Per Share Paid a. Using the SPSS results above, state the Regression Equation (Model) for this problem) b. If an asset does not pay dividends, what will be the price of the asset? c. If an asset pays $3.75 per share, what will be the price of the asset? d. State the Null and Alternate Hypothesis that Dividends per Share may or may not affect the Price per Share for a company e. What is the Critical Z value for the test at .01 Level of Significance? f. What is your conclusion? Explain your answer.1. Test the hypothesis (at .01 Level of Significance) that there is no difference between the Wages of Males compared to Females 2. You must state the Null and Alternate Hypotheses 3. You must state the Critical Z Statistic for the test 4. You must state the Decision Rule and justify your decision Independent Samples Test -test for Equality of Means 95% Confidence Sig. Mean Std. Error Interval of the Difference of (2-tailed) Difference Difference Lower Upper Annual Wages in 3.776 98 000 -12041.414 3188.695 -18369.275 -5713.553 Dollars -3.863 91.753 000 -12041.414 3117.146 -18232.557 -5850.271 Years of Education -.810 98 420 -.454 560 -1.566 658 -.832 88.625 408 -.454 546 -1.539 630According to a real estate agent in Staten Island, the Average Living Space in a Mariners neighborhood house is less than 2,000 square feet. Using the data in Table 3 (Hint: Calculate the Z value for the test and assume a Z* = 2,839). State the Null and Alternate Hypotheses to test the real estate agent's claim at a = .005. What is your conclusion? Table 3 Summary Statistics Std. Std. Error Neighborhood N Averages Deviation Mean Price Per Square Foot Westerleigh 50 $305.79 $76.280 $10.788 Mariners 22 $194.35 $50.879 $10.847 Living Space in House Square Feet Westerleigh 50 1439.94 476.621 67.404 Mariners 22 1954.64 419.440 89.425
Step by Step Solution
There are 3 Steps involved in it

Get step-by-step solutions from verified subject matter experts