

Question: 1. (1 point) In the spreadsheet below, please use Excel function Duration to create a Data Table in which the duration is computed as a
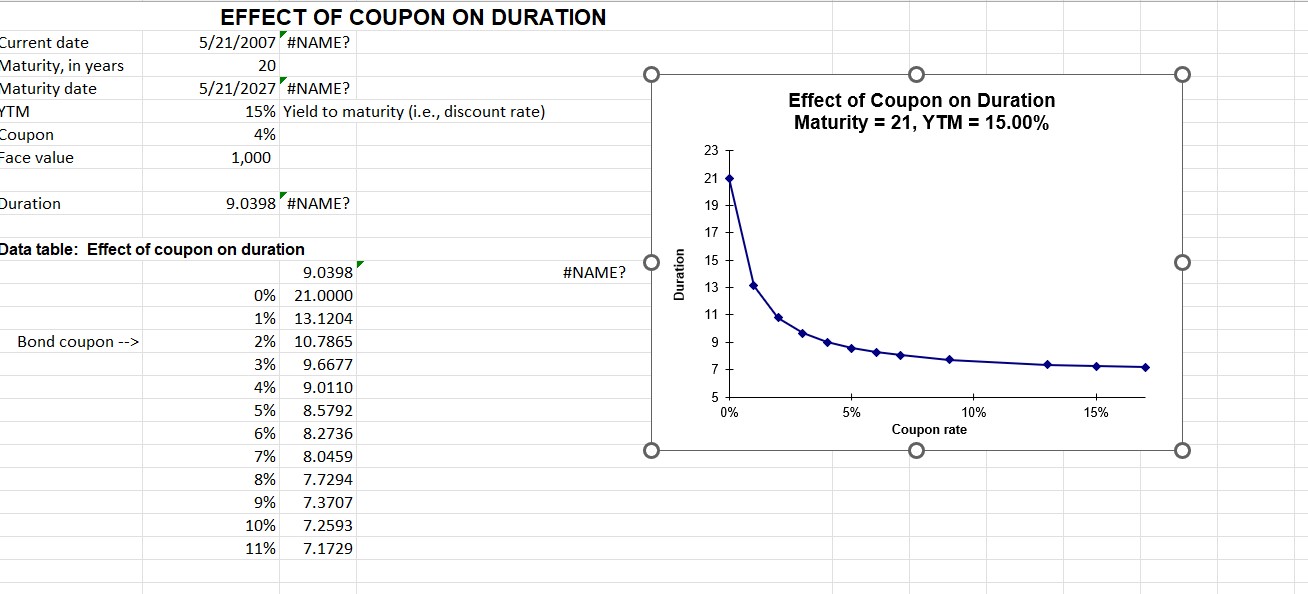
1. (1 point) In the spreadsheet below, please use Excel function Duration to create a Data Table in which the duration is computed as a function of the coupon rate (coupon = 0%, 1%, ..., 11%). Plot the duration and coupon rate based on your Data Table with the duration on the vertical axis and the coupon rate on the horizontal axis. Please mark "duration" for the vertical axis and "coupon rate" for the horizontal axis in the graph.
Step by Step Solution
There are 3 Steps involved in it
1 Expert Approved Answer
Step: 1 Unlock

Question Has Been Solved by an Expert!
Get step-by-step solutions from verified subject matter experts
Step: 2 Unlock
Step: 3 Unlock