

Question: 1. (1 point) State the topic variable (indicator) that you are using. Refer to the data catalog to understand the variable names. 2. (4
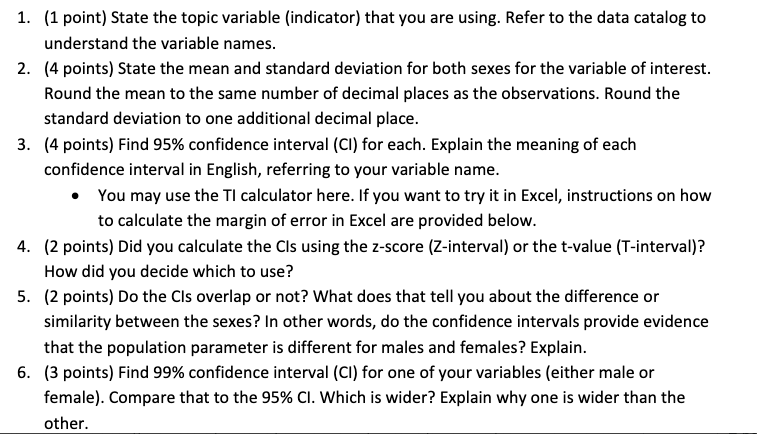
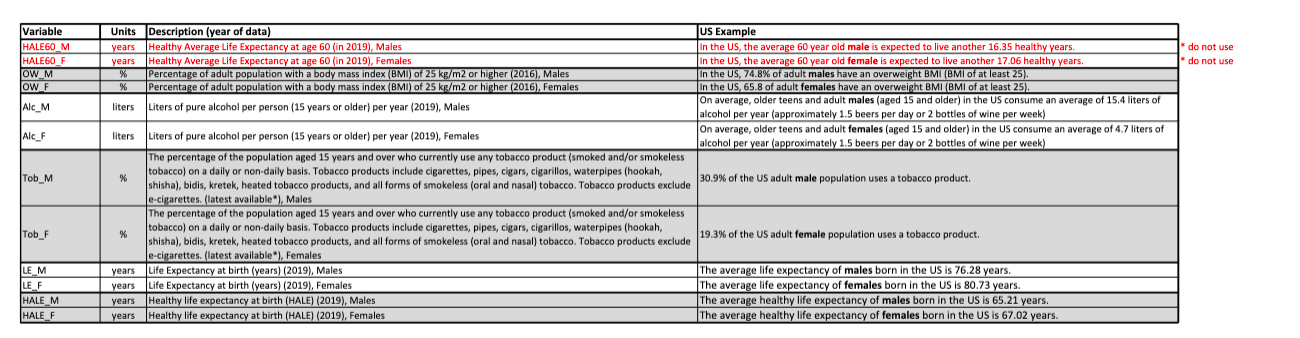
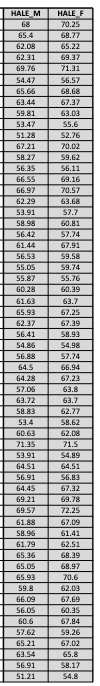
1. (1 point) State the topic variable (indicator) that you are using. Refer to the data catalog to understand the variable names. 2. (4 points) State the mean and standard deviation for both sexes for the variable of interest. Round the mean to the same number of decimal places as the observations. Round the standard deviation to one additional decimal place. 3. (4 points) Find 95% confidence interval (CI) for each. Explain the meaning of each confidence interval in English, referring to your variable name. You may use the TI calculator here. If you want to try it in Excel, instructions on how to calculate the margin of error in Excel are provided below. 4. (2 points) Did you calculate the Cls using the z-score (Z-interval) or the t-value (T-interval)? How did you decide which to use? 5. (2 points) Do the Cls overlap or not? What does that tell you about the difference or similarity between the sexes? In other words, do the confidence intervals provide evidence that the population parameter is different for males and females? Explain. 6. (3 points) Find 99% confidence interval (CI) for one of your variables (either male or female). Compare that to the 95% CI. Which is wider? Explain why one is wider than the other. Healthy Average Life Expectancy at age 60 (in 2019), Females Variable Units Description (year of data) HALE60_M HALE60_F OW_M years years Healthy Average Life Expectancy at age 60 (in 2019), Males % OW F Alc_M % Alc_F Tob_M Tob_F ||Percentage of adult population with a body mass index (BMI) of 25 kg/m2 or higher (2016), Males Percentage of adult population with a body mass index (BMI) of 25 kg/m2 or higher (2016), Females liters Liters of pure alcohol per person (15 years or older) per year (2019), Males liters Liters of pure alcohol per person (15 years or older) per year (2019), Females % % LE_M LE_F HALE_M years years years HALE_F years The percentage of the population aged 15 years and over who currently use any tobacco product (smoked and/or smokeless tobacco) on a daily or non-daily basis. Tobacco products include cigarettes, pipes, cigars, cigarillos, waterpipes (hookah, US Example In the US, the average 60 year old male is expected to live another 16.35 healthy years. In the US, the average 60 year old female is expected to live another 17.06 healthy years. | In the US, 74.8% of adult males have an overweight BMI (BMI of at least 25). In the US, 65.8 of adult females have an overweight BMI (BMI of at least 25). On average, older teens and adult males (aged 15 and older) in the US consume an average of 15.4 liters of alcohol per year (approximately 1.5 beers per day or 2 bottles of wine per week) On average, older teens and adult females (aged 15 and older) in the US consume an average of 4.7 liters of alcohol per year (approximately 1.5 beers per day or 2 bottles of wine per week) shisha), bidis, kretek, heated tobacco products, and all forms of smokeless (oral and nasal) tobacco. Tobacco products exclude 30.9% of the US adult male population uses a tobacco product. e-cigarettes. (latest available"), Males The percentage of the population aged 15 years and over who currently use any tobacco product (smoked and/or smokeless tobacco) on a daily or non-daily basis. Tobacco products include cigarettes, pipes, cigars, cigarillos, waterpipes (hookah, shisha), bidis, kretek, heated tobacco products, and all forms of smokeless (oral and nasal) tobacco. Tobacco products exclude e-cigarettes. (latest available*), Females Life Expectancy at birth (years) (2019), Males Life Expectancy at birth (years) (2019), Females Healthy life expectancy at birth (HALE) (2019), Males Healthy life expectancy at birth (HALE) (2019), Females 19.3% of the US adult female population uses a tobacco product. The average life expectancy of males born in the US is 76.28 years. The average life expectancy of females born in the US is 80.73 years. The average healthy life expectancy of males born in the US is 65.21 years. The average healthy life expectancy of females born in the US is 67.02 years. do not use do not use HALE M HALE F 68 70.25 65.4 68.77 62.08 65.22 62.31 69.37 69.76 71.31 54.47 56.57 65.66 68.68 63.44 67.37 59.81 63.03 53.47 55.6 51.28 52.76 67.21 70.02 58.27 59.62 56.35 56.11 66.55 69.16 66.97 70.57 62.29 63.68 53.91 57.7 58.98 60.81 56.42 57.74 61.44 67.91 56.53 59.58 55.05 59.74 55.87 55.76 60.28 60.39 61.63 63.7 65.93 67.25 62.37 67.39 56.41 58.93 54.86 54.98 56.88 57.74 64.5 66.94 64.28 67.23 57.06 63.8 63.72 63.7 58.83 62.77 53.4 58.62 60.63 62.08 71.35 71.5 53.91 54.89 64.51 64.51 56.91 56.83 64.45 67.32 69.21 69.78 69.57 72.25 61.88 67.09 58.96 61.41 61.79 62.51 65.36 68.39 65.05 68.97 65.93 70.6 59.8 62.03 66.09 67.69 56.05 60.35 60.6 67.84 57.62 59.26 65.21 67.02 63.54 65.8 56.91 58.17 51.21 54.8
Step by Step Solution
There are 3 Steps involved in it

Get step-by-step solutions from verified subject matter experts