

Question: 1 1 point What critical value would you use when conducting a goodness-of-fit test on these data? Do not round your answer Favorite Winter Sport
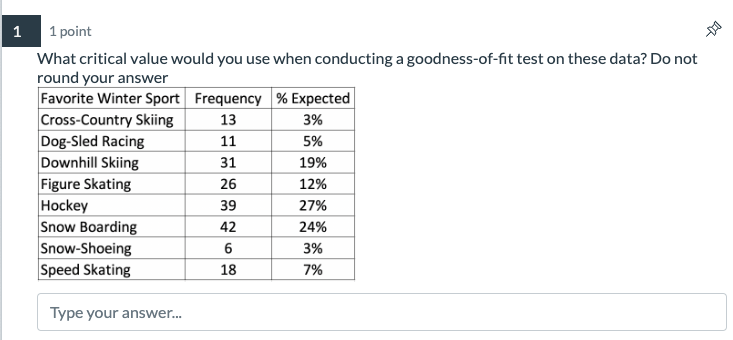

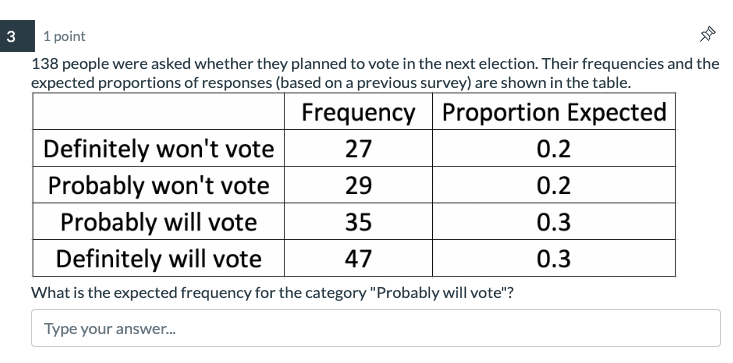


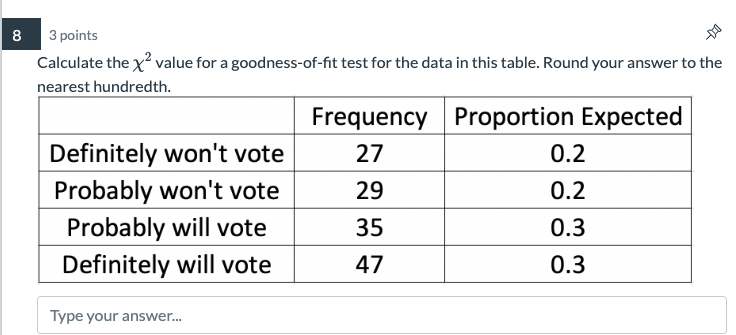

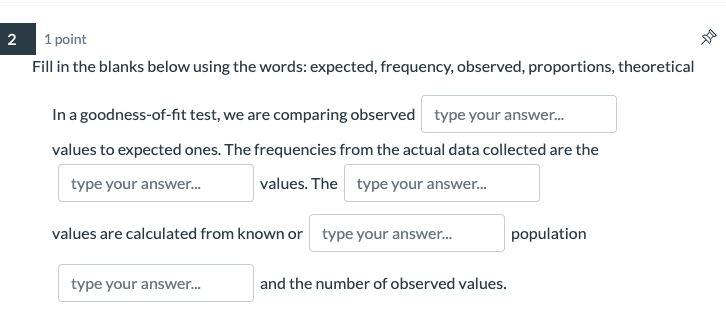

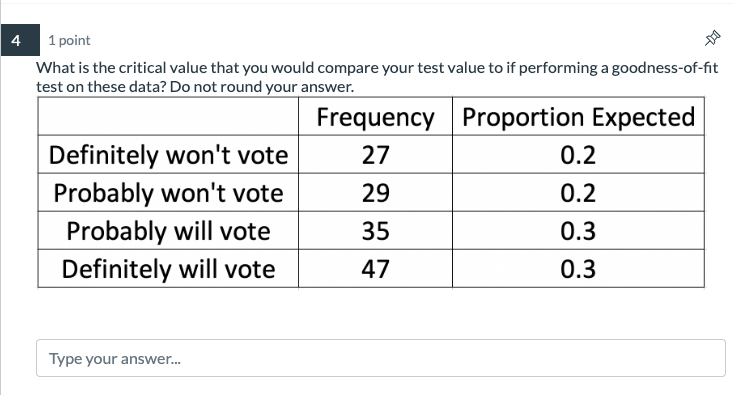
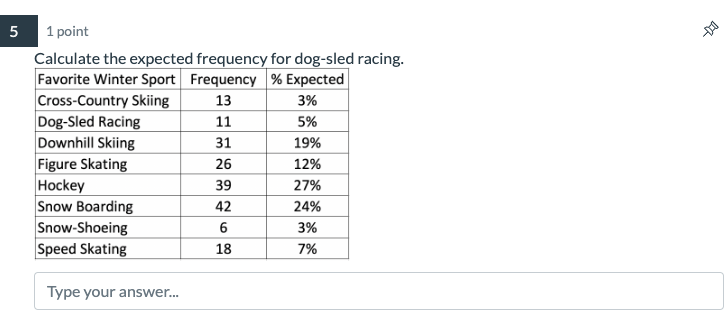
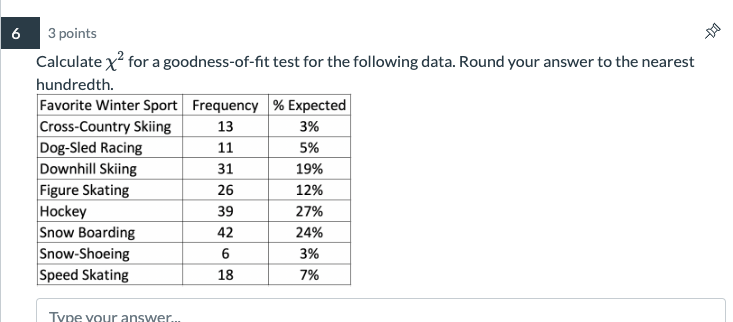
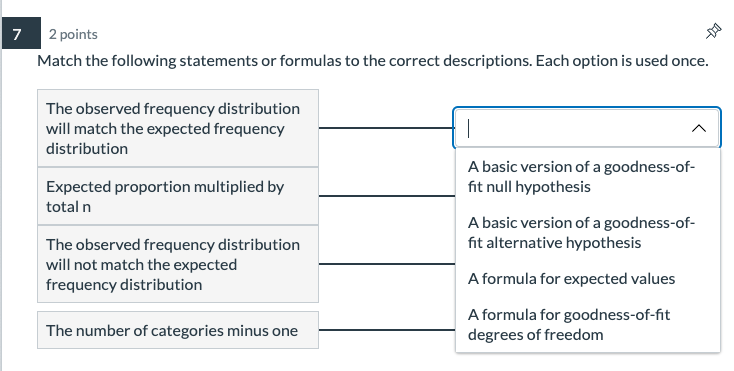

1 1 point What critical value would you use when conducting a goodness-of-fit test on these data? Do not round your answer Favorite Winter Sport Frequency % Expected Cross-Country Skiing 13 3% Dog-Sled Racing 11 5% Downhill Skiing 31 19% Figure Skating 26 12% Hockey 39 27% Snow Boarding 42 24% Snow-Shoeing 6 3% Speed Skating 18 7% Type your answer..'1 point 5?\" Fill in the blanks below usingthe words: expected, frequency, observed. proportions, theoretical In a good ness-of-t test, we are comparing observed type your answer... values to expected ones. The frequencies from the actual data collected are the type your answer... values. The type your answer... values are calculated from known or type your answer... population type your answer... and the number of observed values. 3 1 point 138 people were asked whether they planned to vote in the next election. Their frequencies and the expected proportions of responses (based on a previous survey) are shown in the table. Frequency Proportion Expected Definitely won't vote 27 0.2 Probably won't vote 29 0.2 Probably will vote 35 0.3 Definitely will vote 47 0.3 What is the expected frequency for the category "Probably will vote"? Type your answer.. '1 point 53'? What is the critical value that you would compare your test value to if performing a goodnessoft teet on these data? Do not round your answer. _ Proportion Expected Definitely won't vote Probably won't vote \" Probably will vote Definitely will vote Type your answer... 5 1 point Calculate the expected frequency for dog-sled racing. Favorite Winter Sport Frequency % Expected Cross-Country Skiing 13 3% Dog-Sled Racing 11 5% Downhill Skiing 31 19% Figure Skating 26 12% Hockey 39 27% Snow Boarding 42 24% Snow-Shoeing 6 3% Speed Skating 18 7% Type your answer...6 3 points Calculate x for a goodness-of-fit test for the following data. Round your answer to the nearest hundredth. Favorite Winter Sport Frequency % Expected Cross-Country Skiing 13 3% Dog-Sled Racing 11 5% Downhill Skiing 31 19% Figure Skating 26 12% Hockey 39 27% Snow Boarding 42 24% Snow-Shoeing 6 3% Speed Skating 18 7% Type your answer7 2 points Match the following statements or formulas to the correct descriptions. Each option is used once. The observed frequency distribution will match the expected frequency distribution A basic version of a goodness-of- Expected proportion multiplied by fit null hypothesis total n A basic version of a goodness-of- The observed frequency distribution fit alternative hypothesis will not match the expected frequency distribution A formula for expected values A formula for goodness-of-fit The number of categories minus one degrees of freedom8 3 points Calculate the value for a goodness-of-fit test for the data in this table. Round your answer to the nearest hundredth. Frequency Proportion Expected Definitely won't vote 27 0.2 Probably won't vote 29 0.2 Probably will vote 35 0.3 Definitely will vote 47 0.3 Type your
Step by Step Solution
There are 3 Steps involved in it

Get step-by-step solutions from verified subject matter experts