

Question: 1 1. Scatterplot A displays the relationship between two variables, x and y. Scatterplots B and C display the same relationship with an extra point
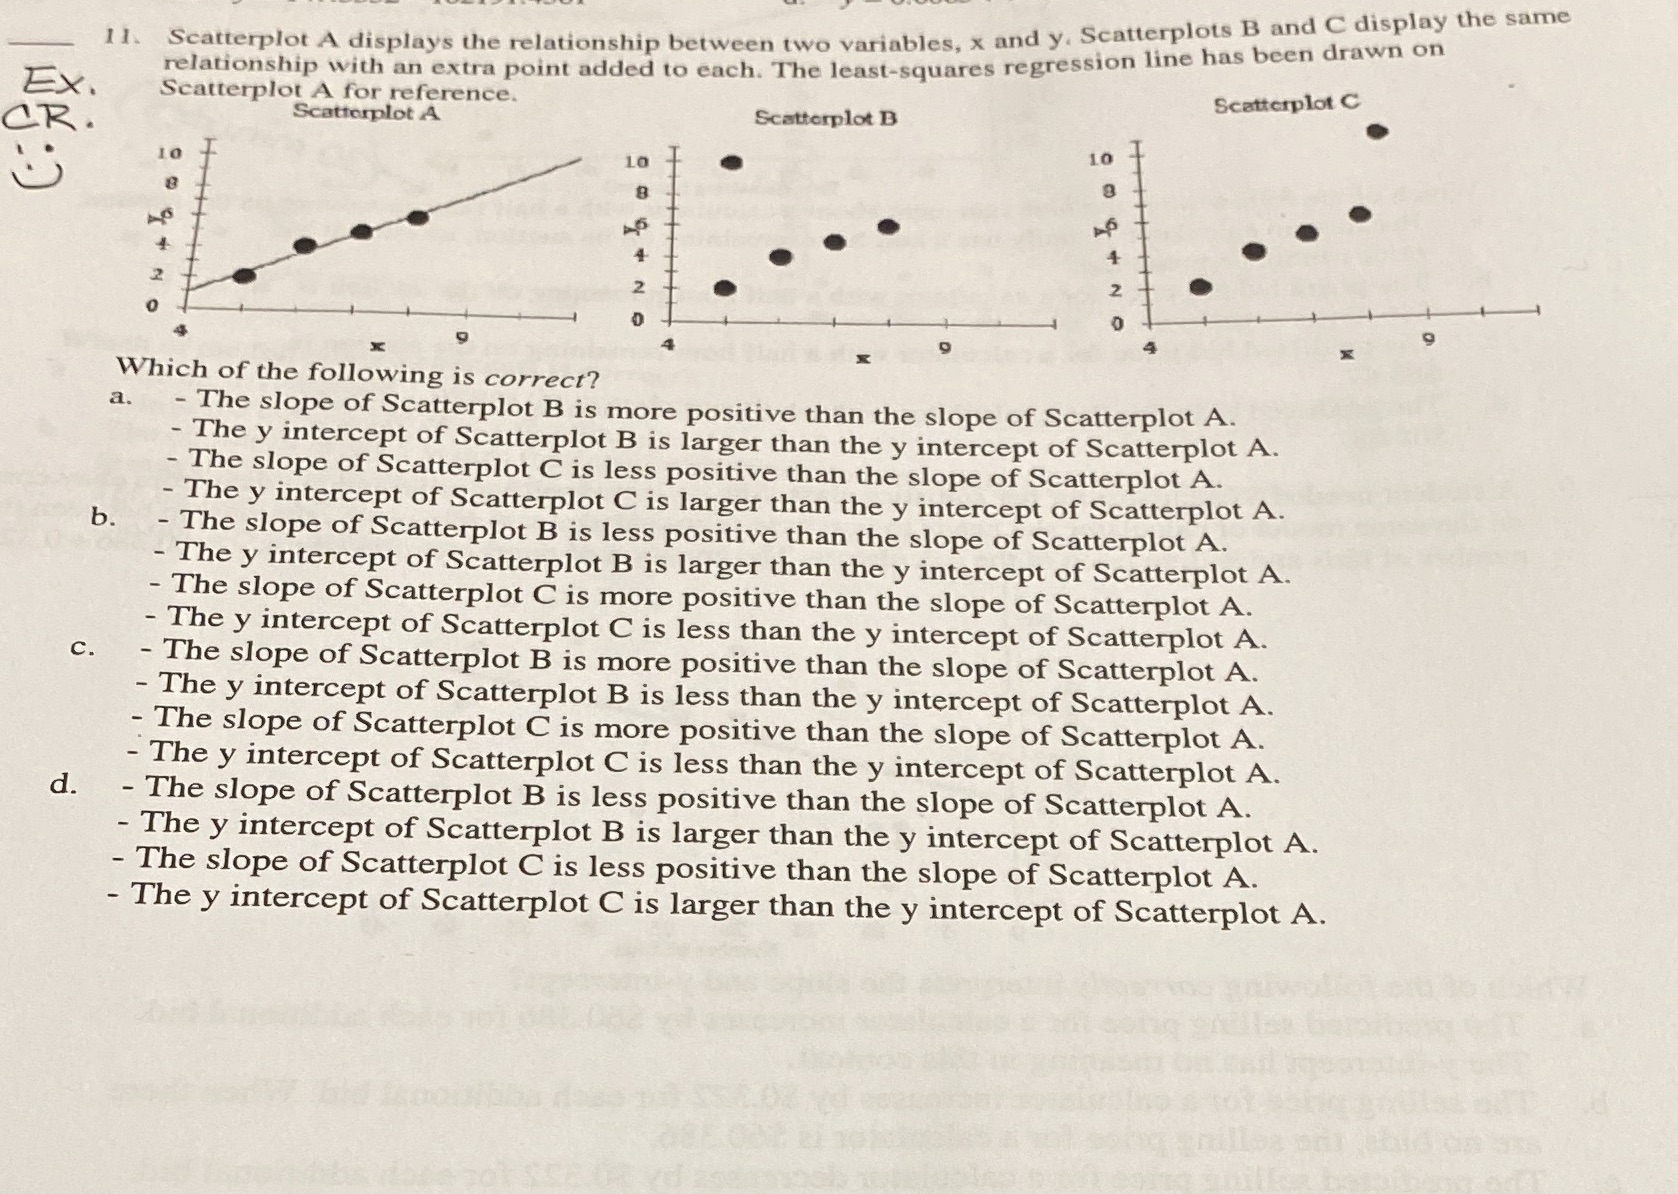
1 1. Scatterplot A displays the relationship between two variables, x and y. Scatterplots B and C display the same relationship with an extra point added to each. The least-squares regression line has been drawn on EX . Scatterplot A for reference. Scatterplot C CR. Scatterplot A Scatterplot B 10 10 N 9 Which of the following is correct? a. - The slope of Scatterplot B is more positive than the slope of Scatterplot A. - The y intercept of Scatterplot B is larger than the y intercept of Scatterplot A. - The slope of Scatterplot C is less positive than the slope of Scatterplot A. - The y intercept of Scatterplot C is larger than the y intercept of Scatterplot A. b. - The slope of Scatterplot B is less positive than the slope of Scatterplot A. - The y intercept of Scatterplot B is larger than the y intercept of Scatterplot A. - The slope of Scatterplot C is more positive than the slope of Scatterplot A. - The y intercept of Scatterplot C is less than the y intercept of Scatterplot A. C. - The slope of Scatterplot B is more positive than the slope of Scatterplot A. - The y intercept of Scatterplot B is less than the y intercept of Scatterplot A. - The slope of Scatterplot C is more positive than the slope of Scatterplot A. - The y intercept of Scatterplot C is less than the y intercept of Scatterplot A. d. - The slope of Scatterplot B is less positive than the slope of Scatterplot A. - The y intercept of Scatterplot B is larger than the y intercept of Scatterplot A. - The slope of Scatterplot C is less positive than the slope of Scatterplot A. - The y intercept of Scatterplot C is larger than the y intercept of Scatterplot A
Step by Step Solution
There are 3 Steps involved in it

Get step-by-step solutions from verified subject matter experts